The metabolism of oil extraction: A bottom-up approach applied to the case of Ecuador

Parra, R., Di Felice, L.J., Giampietro, G., Ramos-Martin, J. (2018): The metabolism of oil extraction: A bottom-up approach applied to the case of Ecuador”, Energy Policy, Vol. 122: 63-74. https://doi.org/10.1016/j.enpol.2018.07.017

Free download before September 9, 2018: https://authors.elsevier.com/c/1XQVW14YGgXhLw

enpol2018Abstract: The global energy system is highly dependent on fossil fuels, which covered approximately 90% of primary energy sources in 2016. As the quality and quantity of oil extracted changes, in response to changes in end uses and in response to biophysical limitations, it is important to understand the metabolism of oil extraction – i.e. the relation between the inputs used and the output extracted. We formalize a methodology to describe oil extraction based on the distinction between functional and structural elements, using the Multi-Scale Integrated Analysis of Societal and Ecosystem Metabolism (MuSIASEM) to generate a diagnostic of the performance of oil extraction and to build scenarios. The analysis allows generating modular benchmarks which are applicable to other countries. It is shown that oil extraction in Ecuador consumes, per cubic meter of crude oil extracted, over 100 kWh of electricity and 1.5 GJ of fuels, requiring 3 kW of power capacity and 2 h of human activity. A scenario is developed to check the effects on Ecuador’s metabolic pattern of an increase in oil production over the next five years. The strength of the proposed methodology is highlighted, focusing on the adaptability of the method for dealing with policy issues.

Keywords: Oil extraction, MuSIASEM, Ecuador, Metabolism, Complexity

JEL Codes: Q02, Q35, Q41, Q57

Despite efforts to reduce greenhouse gas (GHG) emissions and to shift towards a renewable energy system, oil remains an essential part of the global energy chain, with 3820 Mtoe consumed in 2015, out of a total final energy consumption of 9383 Mtoe (International Energy Agency, 2017). This is partly due to the fact that most renewable systems propose an alternative to electricity, rather than fuels. With sustainability issues tied to biofuels, particularly due to concerns over land use in relation to food security (Rathmann et al., 2010), as well as their low energetic output (Rajagopal et al., 2007), it is unlikely that conventional fuels will be phased out in the near future. Given the huge role that oil plays in societies, it is important to understand its metabolism – intended here as the interaction of internal factors determining the relation between the profile of inputs and outputs – particularly in relation to the internal consumption of energy carriers and other flows and funds (see Section 3.1 for a definition), such as water, chemicals, power capacity and human activity.

The aim of the paper is two-fold: on one hand, to develop methodological tools allowing us to describe the oil extraction process by accounting for various flows and funds across different levels; on the other, to apply the methodology to the case of Ecuador, both characterizing the factors determining the current metabolism and developing a scenario for future extraction and policy.

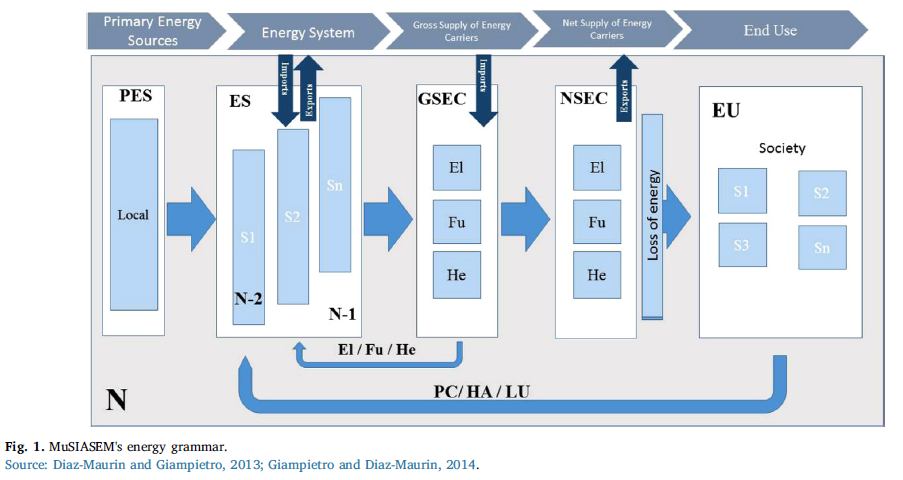
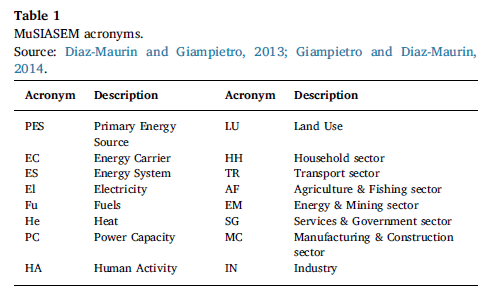
The MuSIASEM energy grammar has been described and applied in detail – see, for example, Velasco-Fernandez et al. (2015) and Giampietro et al. (2014). Its two main concepts, essential to understand the proposed analysis, are the distinction between primary energy sources (PES) and energy carriers (EC), and the disaggregation between mechanical energy (electricity) and thermal energy (heat and fuels). Fig. 1 shows the formalization of MuSIASEM’s energy grammar. A list of the acronyms introduced in Fig. 1, and used throughout the paper, is also provided in Table 1.

Fig1

Tab1

Recent developments in MuSIASEM have seen the introduction of a new conceptual tool called processor (Giampietro, 2018; González-López and Giampietro, 2017; Ripa and Giampietro, 2017; Ripoll-Bosch and Giampietro, 2017), whose aim is to describe the inputs and outputs of flows and funds of a certain process linking it with processes both at the same level and across different levels. Fig. 2 shows an example of a sequential pathway of processors for the fuel chain, starting from oil extraction and ending with transport of fuels to society. Here, the output of one processor becomes an input for the next, and each processor fulfilling a certain function (e.g. “oil extraction”) can be mapped
onto different structural processors. Each processor is characterized by a profile of inputs and outputs. Inputs coming from society (produced by processes under human control) are represented at the top of the processor. The useful output, either fulfilling a function for a following processor or being used by society, is represented by the arrow exiting the processor on the right. Inputs from the ecosystem (blue arrows) and outputs to the ecosystem, such as emissions (yellow arrows), are represented at the bottom.

Fig2

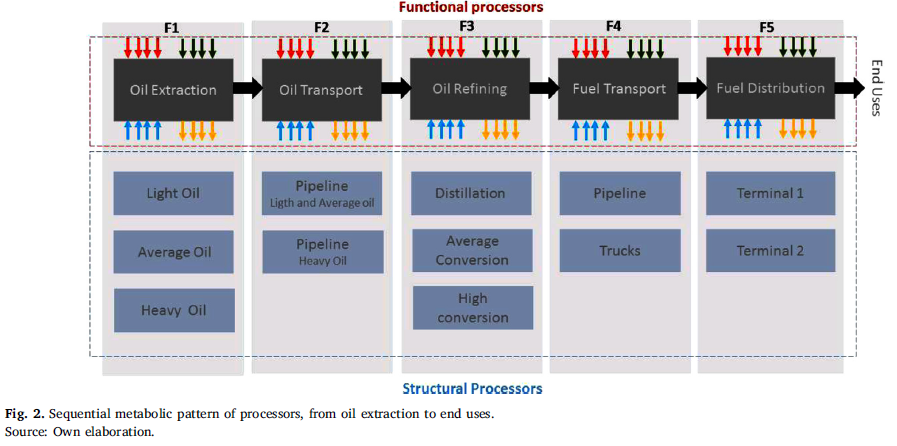
Structural processors describe a process taking place through a specific technology or method, for example oil extraction with deep sea drilling. The characteristics of these processors reflect the technical coefficients determined by the organizational structure of the plant carrying out the process. Functional processors, on the other hand, describe notional elements of a process whose aim is to provide a function within a wider system: for example, fuel refined for the transport system. The characteristics of these processors are defined by the function that has to be expressed to stabilize the metabolism of the larger whole. Theoretical ecology explains the notional definition of a functional processor in terms of mutual information – i.e. a metabolic network (i.e. an ecosystem) defines a virtual image of the metabolic characteristics of the node (network niche) which is independent of the actual characteristics of the metabolic element of the node (Ulanowicz, 1986).

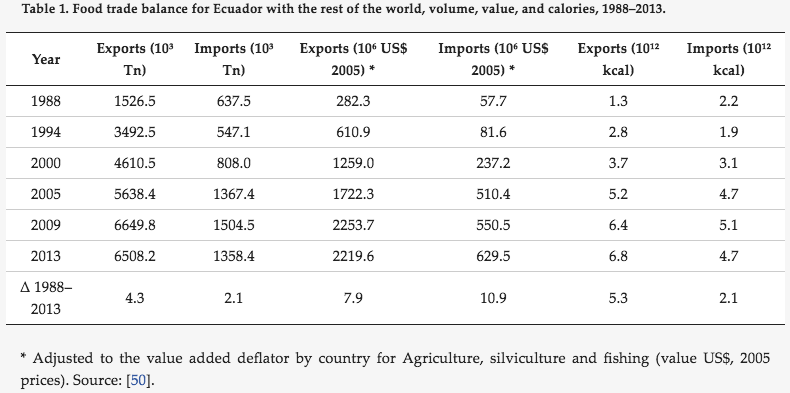
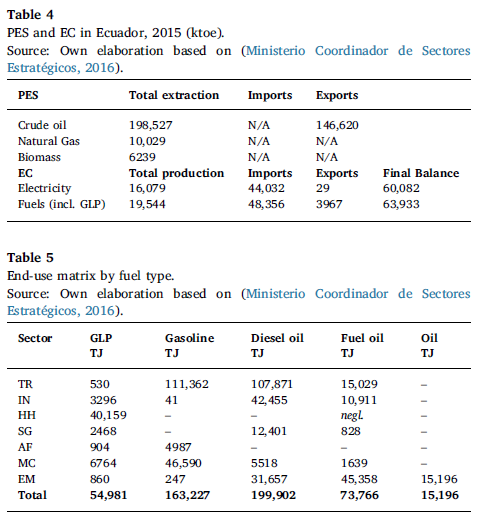
Table 4 shows an overview of Ecuador’s energy system, focusing on primary energy sources (PES) and energy carriers (EC), including imports and exports. As data for 2016 is not available yet, data for 2015 was used, taken from Ecuador’s annual energy balance, published by the Ministry of Strategic Sectors (Ministerio Coordinador de Sectores Estratégicos, (Ministerio Coordinador de Sectores Estratégicos, 2016)). Oil accounts for almost 90% of the primary energy mix. However, due to a lack of refining capacity, Ecuador is a net exporter of crude oil and net importer of refined fuels.

Leaving electricity aside and focusing on fuels, Table 5 shows the final consumption of fuels by societal sub-sectors, splitting them into GLP, diesel oil, fuel oil and gasoline. The disaggregation of both different fuels and of different societal compartments is needed to characterize end uses and to be able to have a complete overview not only of what is being produced, but also of how and where it is being consumed.

Tab4

Looking at Ecuador’s 2016 metabolic pattern for oil extraction, we can see that:
– On average, over 100 kWh of electricity are needed for each cubic meter of crude oil extracted;
– Approximately 1.5 GJ of fuels are consumed for each cubic meter of crude oil extracted: most of them (1.3 GJ) are used to generate electricity on site, and the rest to operate machinery;
– As for funds, approximately 0.032 kW of power capacity are needed for each cubic meter of crude oil extracted; and 2 h of human activity, including both direct (operational) and indirect (administrative) jobs;
– Considering water use, almost 8m3 of fluid (water, gas and oil) are extracted for each cubic meter of oil recovered – 0.2m3 of freshwater are consumed per unit of extraction, and almost 6m3 of water are reinjected;
– Finally, the oil extraction step contributes to overall CO2 emissions by producing almost 84 kg of CO2 per cubic meter of oil extracted.

This framework is useful for two purposes. Firstly, it allows us to have a detailed description of the flows and the funds consumed by Ecuador’s oil extraction sector, as briefly outlined, identifying the relevant elements of the system. Given the lack of data on this step of the fuel chain, the metabolic description is valuable for energy analyses.

Secondly, the characterization of these elements in the form of processors allows checking how the combination of various elements of the oil extraction process contributes to its final metabolism, and how changing the relative weight of the elements affects the flows and funds of the final oil extraction processor, as will be seen in the next subsection.

The results for Ecuador showed that currently medium oil dominates the market, and that at the moment the extraction process on average requires, per cubic meter of oil extracted, over 100 kWh of electricity, 1.5 GJ of fuels, 3 kW of power capacity, 2 h of human activity and 6.2m3 of freshwater, of which 6m3 are reinjected. The extraction process also generates, per cubic meter of oil extracted, almost 85 kg of CO2 emissions. The package of indicators that are generated by the approach allows providing an integrated assessment of the performance of the investigated process in the form of a multi-criteria analysis. For example: (i) the profile of inputs of energy carriers (electricity, and fuels) are relevant for calculating the Energy Return on the Energy Investment (mapping both on the speed of depletion of the stock of resources and on emissions of CO2 per net supply); (ii) the requirement of power capacity (technology) is an indicator relevant for assessing the fixed economic costs; (iii) the requirement of labor is relevant both for assessing the economic costs and the opportunity for employment; (iv) the information about freshwater and CO2 emissions is relevant for an
analysis of environmental impact. Future work will focus on organizing this information in the form of a Multi-Criteria Analysis in order to make it available to decision makers in the form of a decision support system.

The analysis of the proposed scenario showed that extraction of new oil resources in Ecuador will shift from medium to heavy oil, but as this will be done mostly within newer blocks, less Base Sediment Water (BSW) will be produced in the process. This will lower the requirement of inputs per unit of oil produced. However, in order to provide a full overview of the overall effect on Ecuador’s oil extraction metabolism, a time dimension must be introduced in the analysis, checking how processors of the current oil extraction structures will change as they age in terms of flows and funds consumed. It is well known that, in general, older blocks consume more resources. This explains why the
simulated processor focusing only on the delta of increased production, based on the exploitation of new blocks, is less energy and water intensive than Ecuador’s 2016 real processor. Thus, the inclusion of a time dimension to the analysis is identified as a second area for further research.

Livelihood sustainability assessment of coffee and cocoa producers in the Amazon region of Ecuador using household types

Viteri Salazar, O., Ramos-Martin, J., Lomas, P.L. (2018): “Livelihood sustainability assessment of coffee and cocoa producers in the Amazon region of Ecuador using household types”, Journal of Rural Studies, Vol. 62: 1-9. https://doi.org/10.1016/j.jrurstud.2018.06.004

Free download until August 15, 2018: https://t.co/ZhyPNetmic

Screen Shot 2018-07-07 at 09.58.10

Abstract: Supporting small farmer livelihoods in fragile, biodiverse regions, such as tropical forests, is a priority for many development agencies and national governments. These regions tend to be characterized by recent human settlements, increasing populations and infrastructure development, as well as competitive land use activities, which exert pressure on fragile ecosystems. Improvement in livelihood strategies often focuses on increasing yields by improving productivity, but without taking into account alternative methods, such as better agricultural practices and their dependence on agrochemical inputs, changing land use through crop substitution, or improving product commercialization. In this research, we use household types, defined according to different land use patterns, in the Northern Amazon region of Ecuador to explore the limitations of, and identify future options for, improving livelihood strategies based on small-scale coffee and cocoa production. The results of the different types are discussed in order to highlight the methods’ utility and identify benefits in terms of environmental and social objectives versus economic profitability. Lessons are drawn that could be useful in applications of public policy aimed at the betterment of small coffee grower and cocoa farmer livelihood strategies, which involve thousands of families in the Amazon region of Ecuador, without compromising the environment.

Keywords: Household types, Amazon, Ecuador, Livelihoods, Coffee and cocoa, Sustainability

The main objective of this study is to contribute to the evaluation of agricultural production systems. This is done here by using a typology of four predominant production systems and comparing their performance against a set of indicators. A second objective is to inform decision makers about the differentiated outcomes these production systems have, so that tailored policy interventions can be designed based on the evaluation of past initiatives. In particular, this work focuses on: i) identifying the socioeconomic and environmental restrictions implicit in different land use patterns; ii) analysing how different land use patterns improve livelihoods in terms of income; and iii) identifying how certain public policies can lead to the establishment of particular types or lifestyles, thereby generating an impact on the income of small- scale producers.

After collecting the data, a typology of households was established as a method of conceptualization and empirical analysis. Household types have been largely used as societal functional units of analysis within integrated assessments for rural systems (Pastore et al., 1999; Giampietro, 2003; Scheidel et al., 2013; Williams et al., 2015), as well as often employed to strengthen the focus of policies and interventions associated with rural livelihoods (Gomiero and Giampietro, 2001; Niehof and Price, 2001; Senthilkumar et al., 2009; Serrano-Tovar and Giampietro, 2014; Tittonell et al., 2010; Williams et al., 2015).

The characterization of types was made in terms of land use patterns and impacts upon the environment, whether through the use of synthetic inputs, the implementation of monocultures or the expansion of the agricultural frontier and the consequent reduction in the forested area. The classification of typologies was based on the technical data sheets suggested by the National Institute of Agricultural Research (Instituto Nacional de Investigaciones Agropecuarias), in terms of area, level of agrochemical use, crop combination, etc., with consideration given to these recommendations as thresholds.

One characteristic shared by the different types is the need for crops that guarantee a permanent inflow of cash. In all cases, apart from coffee and cocoa, there are “other crops” (plantain, maize, cassava, rice and fruit trees) that help in providing food security to households. The types defined include farmers who share at least one of the cash crops, as follows: Type 1 contains coffee and cocoa plantations (CC); Type 2 contains only cocoa cultivation (C); Type 3 comprises coffee, cocoa and oil palm plantations (CCP); and finally, Type 4 only has coffee farming (Cf).

Screen Shot 2018-07-07 at 10.10.00

Screen Shot 2018-07-07 at 10.10.14

Income from coffee and cocoa production represents about 19% of total household income for Types 1 and 2 despite their low yield, whereas it is only 8% for Types 3 and 4. Type 3 earns more from other crops and oil palm, while Type 4 receives the most from off-farm work, although production at the farm still plays a cultural and environmental role.

Under these circumstances, Type 4 performs very well in environmental terms (LIU and 24 ha of forest) and is very close to Type 2 in economic terms. Hence, there is a need to increase income via improving some agricultural practices (e.g., pruning), selecting plants and particularly changing to commercialization, thus making it possible for smallholders to move up the value chain. Unless measures supporting productive activity of this type are implemented, a shift towards Types 1 and 2 could be expected, or even worse towards Type 3 by means of selling or renting their land.

The analysis of the surplus generated by each type helps in identifying the reasons why households have chosen different productive patterns. It can be seen how cocoa has gradually replaced the cultivation of coffee. According to the Third National Agricultural Census (2000), 49,389 ha of coffee and 7751 ha of cocoa were present in the area, while, according to our study, there were 44,580 ha of cocoa and 9500 ha of coffee in 2013 (Fig. 2). This is consistent with our results, as Type 2 has a higher surplus than Type 1, which has the lowest surplus of all and depends largely on off-farm work for guaranteeing livelihood. Until 10 years ago, large-scale landowners dominated oil palm plantations. Only recently have smallholders engaged in oil palm production, thus giving rise to Type 3. Despite the fact that plantations are still young (four to eight years), they already show the highest surplus (US $144.63); however, from an environmental point of view, they are the least interesting of all, because they involve a HIU, with forest only covering 4% of land, and the number of families that have benefited from that is very low (4.5%). One can understand why private enterprises and even the central government are interested in this type (profits, but also greater GDP and taxes). However, this type also re- presents more environmental impacts and a greater degree of dependency for the households (a large fraction of their income is ex- pended in buying agrochemicals from the very same intermediaries who are commercializing palm oil). These reasons do not make this type, in our view, an option for future development.

Screen Shot 2018-07-07 at 10.13.31

Creating types for an analytical case study in one of the most important areas of the Ecuadorian Amazon, with highly biodiverse ecosystems and significant forest cover, allows for visualizing different land use patterns linked to economic resource generation as a means of subsistence. This behaviour is strongly linked to public policies being developed in the sector, where it is believed that oil palm monocultures could be a better alternative revenue source for farmers. However, as shown in Types 2 and 4, its utility is very similar to Type 3 (oil palm), but with a much lower dependence on intensive agrochemical use in the case of Type 2 and a practically null value in Type 4, which hardly uses agrochemical inputs. The differentiated performance of types should encourage the design of tailored interventions to address the problems encountered by each of them, promoting those types with less environmental impact, but which still provide the necessary means for livelihoods and incentives for the conversion of the types with more impact.

The intensity of land use, marked in large part by the expansion of the agricultural frontier and the reduction in forest cover on farms, is much lower in Type 4 than in the other types, making this form of production more desirable in environmental terms. However, this type shows a limitation in terms of income generation, as nearly 35% of its income comes from off-farm work performed by dayworkers. This aspect is important to consider in the development of agricultural programmes oriented toward jump-starting production, where time dedicated by farmers is an important variable, since this type would not have any time restrictions when either adopting a more labour-intensive agricultural practice or expanding the agricultural frontier. In contrast, Type 4 reflects the practical impossibility of adding crops to a farm, since agricultural use of the available land surface is found to be at 96% capacity.

Identifying the land use and economic income corresponding to types has also revealed the fact that Type 2 represents the lowest labour demand per hectare, an aspect that could be useful for pushing programmes focused on cocoa production, in which labour availability, on the one hand, and profitability per hectare for cocoa and coffee, on the other, should be analysed.

The concept of caloric unequal exchange and its relevance for food system analysis: The Ecuador case study

Ramos-Martin, J., Falconi, F., Cango, P. (2017): “The concept of caloric unequal exchange and its relevance for food system analysis: The Ecuador case study”, Sustainability, Vol 9(11), 2068. http://www.mdpi.com/2071-1050/9/11/2068/pdf 
http://dx.doi.org/10.3390/su9112068 

Sustainability2017

Abstract: The impact of food production patterns and food supply upon consumption patterns is usually explained by economies of scale and affordability. Less attention is given to food trade patterns and global insertion of economies affecting dietary changes. This paper contributes to the discussion using the concept of caloric unequal exchange that defines the deterioration of terms of trade in food in units of calories and complements studies on unequal exchange and ecologically unequal exchange. A new perspective to food systems’ analysis is achieved by using this concept. This paper uses the case study of Ecuador to exemplify its potentiality. Exports and imports to and from Ecuador are analyzed for the period 1988 through 2013 in volume, value, and calories, for different groups of products. The conclusion is that Ecuador is increasingly helping to feed the world, at a caloric cost that is decreasing over time. There is a deterioration of the terms of trade of traded food in terms of calories for Ecuador of more than 250% between 1986 and 2013.

Keywords: Latin America; caloric unequal exchange; terms of trade; food; Ecuador.

Changes in consumption patterns are usually referred to as being caused by changes in preferences in consumers or certain constraints, such as those of a budgetary nature. Acknowledging the relevance of demand-side determinants for consumption, we believe the role a country plays in international trade may also be a determinant. A country’s global positioning in trade, concentrated in certain products, may well induce changes in production patterns, which may have an effect, subsequently, on the domestic supply of food products. The traditional way we look at food systems, in terms of supply and demand, seems limited to us. Data in terms of volume and value may well be complemented with data on the relative cost to the calorie of both imports and exports, what we call caloric unequal exchange. In this way, we can have a different look to the concept of domestic availability which links to other concepts such as food sovereignty. The change in domestic availability (and very often affordability) may also induce changes in consumption patterns. With this consideration in mind, the aim of the paper is twofold: (1) to explore the existence of caloric unequal exchange for Ecuador as defined by a recent study; and (2) to explore the links between changes in food consumption patterns, international trade and domestic production of food products.

In order to respond to the two objectives of the paper, we use the recently introduced concept of caloric unequal exchange, defined as the deterioration in the terms of trade of food traded when considering the cost of exported and imported calories, and explained with detail in Section 2. The study originally introducing the concept focused on Latin America and the Caribbean as a block, showing that, even if calories exported were more expensive than those imported, there was a deterioration of the terms of trade since 1961 and the region was increasingly feeding the rest of the world at ever cheaper costs to the calorie. This went along with an increased volume (and value) of exports, making explicit the recent turn, to intensify the international insertion of the region as a provider of commodities to the rest of the world. This international insertion is seen by some as positive from an economic point of view. However, the impacts upon the environment in terms of soil deterioration, export of nutrients, and increased energy consumption and CO2 emissions from those exports, are still not clear as there are only a few studies that analyze the loss of nutrients involved in food exports.

The insertion of Ecuador in the world economy since then has suffered from two facts. On the one hand, the small scale of its economy prevents it from influencing world prices for commodities exported. On the other hand, the loss of monetary policy implied by dollarization prevented the country from using competitive devaluations for gaining market share. The outcome, for all products but particularly for food products, was an increase in volumes exported, as can be seen in Table 1 below.

Table1

Not only did Ecuador increase its exports, but its imports also rose after dollarization. The economy became very open to the global market. The openness index, a measure of the share of imports plus exports over GDP, went from 0.25 in 1965 to 0.57 in 2012, having reached a peak in the year 2008 with a value of 0.64. This vulnerability of the economy to the world markets, aggravated by the lack of industry in the country, implied an increase in food trade as well.

Table 1 presents the food trade balance (for the selected product groups) between Ecuador and the rest of the world for the period 1988 through 2013. Data is presented in volume, monetary value, and its conversion into calories. Exports in volume increased by 4.3 times their original size in the period, less than in terms of calories (5.3), whereas its monetary value increased by 7.9 times. In the case of imports, they increased by 2.1 times in terms of volume and calories, while they increased by 10.9 times in monetary terms.

During the 25-year period analyzed, Ecuador went from exporting double the amount of food that was imported in 1988 to exporting more than five times what was imported in 2013, in terms of volume. This is part of the re-primarization experienced by some of the Latin American economies.

Fig6

Deepening the data analysis shown in Table 1, Figure 6 presents the cost in US dollars of one million kcal exported and imported in real terms (left axis) and the ratio between the cost of the exported calorie and the imported calorie (right axis), that is, an approximation to the terms of trade measured in calories.

The trend observed in the figure is an increase in the cost of exported calories of 47% in the period, but a much higher increase in the cost of imported calories over time (more than 400%), which implied a deterioration of the terms of trade measured in calories, with a decrease of more than 250% in the period analyzed. Thus, Ecuador is feeding the rest of the world at a lower relative cost over time, despite the recent boom in commodity prices experienced worldwide.

Our research also shows the degree of concentration of consumption in a few products, measured in kcal, comparing 1961 and 2011 (see Table 4). This high concentration in a few products did worsen in the period. Table 4 presents the cumulative calorie intake per product in year 1961 and 2011. The number represents the ranking of that product in both years, for instance, sugar was the second product in caloric terms in 1961 but the fourth in 2011. The table reads like this: in 1961 rice represented 12% of calorie intake, and rice plus sugar 23.9%, and so on. In the year 2011, rice represented 24%, while rice and wheat 41.4%, and so on. Five products (rice, sugar, maize, banana and wheat) represented 52.7% of calorie intake in 1961, while the share went up to 71.1% in 2011 (with a change in composition: rice, wheat, palm oil, sugar, soybean oil). When extending to 10 products, they represented 77.1% of consumption in 1961 and 88.4% in 2011. Therefore, apart from a change in the diet, with a noticeable increase in vegetable oils (soybean and palm) and a decrease in beans, cassava and potatoes, a large fraction of consumption is concentrated in a very small number of products and this concentration is increasing over time, reducing the variety of the diet in the country.

Table4

Supplementary materials: The following are available online at www.mdpi.com/2071-1050/9/11/2068/s1, Table S1: CUEE Data.xlsx which includes all the data and references for both figures and tables in the paper.

Using household types for improving livelihood strategies of smallholders: coffee and cocoa producers in the Northern Amazon of Ecuador

Supporting smallholders’ livelihoods in fragile and biodiversity rich regions such as rainforests is a priority of many development agencies and national governments. These regions tend to be characterized by recent settlements, increasing population and infrastructure, as well as land use competing activities that put pressure upon fragile ecosystems. Research aimed at improving livelihood strategies often focuses on increasing yields and productivity, but fails to account for alternative measures such as improving agricultural practices, changing land use or improving commercialization. This paper uses household types defined according to different land use patterns in the northern Amazon region of Ecuador to explore limitations and identify future options for improving livelihood strategies based in the small-scale production of coffee and cocoa. Results for application to four types are discussed, which highlight the utility of the method and identify trade-offs in terms of environmental and social goals versus profitability. Lessons are drawn that can inform public policies oriented to improving livelihood strategies of small producers of coffee and cocoa in the Amazon region without compromising the environment.

The Documento de Trabajo FLACSO Ecuador 2016_02, written by Oswaldo Viteri from Escuela Politécnica Nacional, Jesús Ramos-Martín from FLACSO and Pedro L. Lomas from Universitat Autònoma de Barcelona, presents an evaluation of different household typologies and their relative performance and impact in the northern Amazon region of Ecuador, contributing to the debate on livelihoods, agricultural practices and sustainability.

Table1

The paper analyses four typologies of households: 1) those that plant coffee and cocoa (CC); 2) those with cocoa only (C); 3) those with coffee, cocoa and oil palm (CCP); and 4) those with only coffee (Cf). For each typology, the number of households is identified as well as the surface area, land use (including deforestation), working time for different activities, use of inputs, etc. In this manner, we are able to compare the performance of the different typologies not only in economic terms, but also regarding its environmental impact.

Table11

The paper also presents a scenario analysis assuming certain practices are in place and certain coefficients are respected under both land and time budget constraints. Moreover, the unit of analysis is set to 1,000 ha, so that we can see how many households can be supported by each household typology, and which would be the derived environmental impact. The conclusion is reached that typologies 1 (coffee and cocoa) and 2 (cocoa) may be the most interesting from a public policy perspective.

An improved version of this paper is currently under revision by the Journal of Rural Studies.

The working paper can be downloaded here from FLACSO Andes, and here from RePEc. 

Vulnerabilidad y dependencia internacional de fertilizantes en el Ecuador

En un Working Paper reciente, que lleva registradas 450 descargas hasta el momento, los investigadores de CEPROEC Freddy Llive, Juan Cadillo, Belén Liger y yo mismo, junto con los compañeros de SENPLADES Gabriel Rosero y Evelyn Fraga, analizamos la dependencia que la agricultura ecuatoriana tiene de los fertilizantes de origen fósil, que se importan casi en su totalidad.

El trabajo empieza con un análisis de la suficiencia en la producción y consumo de fertilizantes por regiones a nivel mundial, para continuar con un análisis de la evolución de los precios y finalizar con la situación del Ecuador, como país altamente dependiente del exterior para el funcionamiento de su sector agrícola y, por ende, para su soberanía alimentaria.

Los principales resultados del estudio son:

– Los fertilizantes representan entre el 10 y el 30% de los costos de producción a nivel nacional

– Ecuador ha experimentado un aumento importante del uso de fertilizantes en los últimos años

UsoFertilizantes

– La producción de fertilizantes está fuertemente concentrada y especializada en pocos países

– El precio internacional de los fertilizantes está fuertemente relacionado con el precio del petróleo

PrecioFertilizantes

– Ecuador importa el 99,5% de los fertilizantes utilizados. En 2014, el 68% del total provino solo de tres países: China (208.000 t), Rusia (205.000 t) y Estados Unidos (142.000 t).

OrigenFertilizantes

– Las importaciones implicaron una salida de divisas de 397 M USD en 2014.

El trabajo finaliza con una serie de recomendaciones para el estado ecuatoriano, de tal manera que se haga un uso eficiente de los fertilizantes, se aumente la productividad agrícola y se reduzca la salida de divisas derivada de las importaciones.

El documento de trabajo se puede descargar aquí. Una versión ampliada y mejorada ha sido enviada a la revista Food Policy.

En la página web de nuestro centro encontrarás toda la información tanto de nuestro equipo como de nuestro trabajo.

Consumo de combustible del transporte terrestre en Ecuador

transporte_quito

Consumo de combustible del transporte terrestre en Ecuador

En un trabajo reciente, que lleva más de 950 descargas, el investigador de CEPROEC Jaime Cevallos, analiza la evolución del parque automotor de Ecuador y encuentra que en el período 2003-2013 éste ha crecido a una tasa del 7,8% anual, que en su mayoría es resultado del aumento de automóviles y jeeps, es decir, de vehículos de uso privado.

parque_automotor

Cevallos ha llevado a cabo por primera vez en el Ecuador un análisis empírico que le ha permitido calcular el consumo de combustible por tipología de vehículo. Para ello, ha utilizado datos reales del odómetro de una muestra de vehículos de la ciudad de Quito gracias a la base de datos de la Agencia Nacional de Tránsito (ANT), que ha utilizado para estimar el combustible mediante coeficientes de uso de energía por kilómetro recorrido. Estos resultados han sido ajustados a los valores macro que para el sector del transporte ofrece el Balance Energético realizado por el Ministerio Coordinador de Sectores estratégicos (MICSE).

En cuanto a la distribución del consumo, el transporte terrestre representa el 77% del consumo total de combustibles. El transporte de mercancías implicó un 60% del consumo del sector del transporte, mientras que el transporte de pasajeros un 26%. Cevallos analiza la evolución del parque por tipología de vehículo, la evolución del consumo, así como el impacto de los subsidios (un 68% del costo total del combustible del sector transporte) para aventurarse a una serie de recomendaciones de política energética y fiscal que incluyen, entre otras, la eliminación progresiva del subsidio a la gasolina que solo beneficia a la población con más recursos y no tendría efectos inflacionarios.

El documento de trabajo se puede descargar aquí. Una versión ampliada del mismo ha sido enviada a la revista Energy Policy.

En la página web de nuestro centro encontrarás toda la información tanto de nuestro equipo como de nuestro trabajo.