Ramos-Martin, J., Falconi, F., Cango, P. (2017): “The concept of caloric unequal exchange and its relevance for food system analysis: The Ecuador case study”, Sustainability, Vol 9(11), 2068. http://www.mdpi.com/2071-1050/9/11/2068/pdf
http://dx.doi.org/10.3390/su9112068

Abstract: The impact of food production patterns and food supply upon consumption patterns is usually explained by economies of scale and affordability. Less attention is given to food trade patterns and global insertion of economies affecting dietary changes. This paper contributes to the discussion using the concept of caloric unequal exchange that defines the deterioration of terms of trade in food in units of calories and complements studies on unequal exchange and ecologically unequal exchange. A new perspective to food systems’ analysis is achieved by using this concept. This paper uses the case study of Ecuador to exemplify its potentiality. Exports and imports to and from Ecuador are analyzed for the period 1988 through 2013 in volume, value, and calories, for different groups of products. The conclusion is that Ecuador is increasingly helping to feed the world, at a caloric cost that is decreasing over time. There is a deterioration of the terms of trade of traded food in terms of calories for Ecuador of more than 250% between 1986 and 2013.
Keywords: Latin America; caloric unequal exchange; terms of trade; food; Ecuador.
Changes in consumption patterns are usually referred to as being caused by changes in preferences in consumers or certain constraints, such as those of a budgetary nature. Acknowledging the relevance of demand-side determinants for consumption, we believe the role a country plays in international trade may also be a determinant. A country’s global positioning in trade, concentrated in certain products, may well induce changes in production patterns, which may have an effect, subsequently, on the domestic supply of food products. The traditional way we look at food systems, in terms of supply and demand, seems limited to us. Data in terms of volume and value may well be complemented with data on the relative cost to the calorie of both imports and exports, what we call caloric unequal exchange. In this way, we can have a different look to the concept of domestic availability which links to other concepts such as food sovereignty. The change in domestic availability (and very often affordability) may also induce changes in consumption patterns. With this consideration in mind, the aim of the paper is twofold: (1) to explore the existence of caloric unequal exchange for Ecuador as defined by a recent study; and (2) to explore the links between changes in food consumption patterns, international trade and domestic production of food products.
In order to respond to the two objectives of the paper, we use the recently introduced concept of caloric unequal exchange, defined as the deterioration in the terms of trade of food traded when considering the cost of exported and imported calories, and explained with detail in Section 2. The study originally introducing the concept focused on Latin America and the Caribbean as a block, showing that, even if calories exported were more expensive than those imported, there was a deterioration of the terms of trade since 1961 and the region was increasingly feeding the rest of the world at ever cheaper costs to the calorie. This went along with an increased volume (and value) of exports, making explicit the recent turn, to intensify the international insertion of the region as a provider of commodities to the rest of the world. This international insertion is seen by some as positive from an economic point of view. However, the impacts upon the environment in terms of soil deterioration, export of nutrients, and increased energy consumption and CO2 emissions from those exports, are still not clear as there are only a few studies that analyze the loss of nutrients involved in food exports.
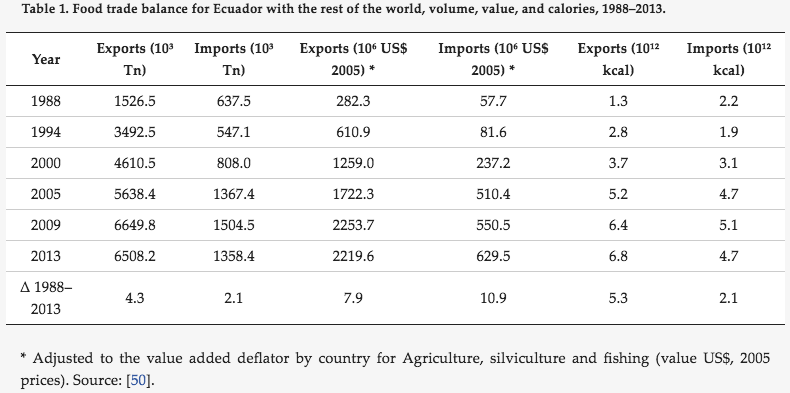
The insertion of Ecuador in the world economy since then has suffered from two facts. On the one hand, the small scale of its economy prevents it from influencing world prices for commodities exported. On the other hand, the loss of monetary policy implied by dollarization prevented the country from using competitive devaluations for gaining market share. The outcome, for all products but particularly for food products, was an increase in volumes exported, as can be seen in Table 1 below.
Not only did Ecuador increase its exports, but its imports also rose after dollarization. The economy became very open to the global market. The openness index, a measure of the share of imports plus exports over GDP, went from 0.25 in 1965 to 0.57 in 2012, having reached a peak in the year 2008 with a value of 0.64. This vulnerability of the economy to the world markets, aggravated by the lack of industry in the country, implied an increase in food trade as well.
Table 1 presents the food trade balance (for the selected product groups) between Ecuador and the rest of the world for the period 1988 through 2013. Data is presented in volume, monetary value, and its conversion into calories. Exports in volume increased by 4.3 times their original size in the period, less than in terms of calories (5.3), whereas its monetary value increased by 7.9 times. In the case of imports, they increased by 2.1 times in terms of volume and calories, while they increased by 10.9 times in monetary terms.
During the 25-year period analyzed, Ecuador went from exporting double the amount of food that was imported in 1988 to exporting more than five times what was imported in 2013, in terms of volume. This is part of the re-primarization experienced by some of the Latin American economies.
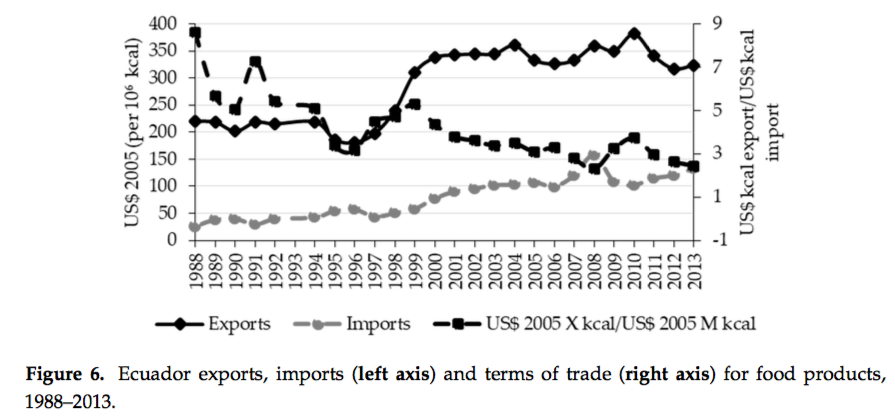
Deepening the data analysis shown in Table 1, Figure 6 presents the cost in US dollars of one million kcal exported and imported in real terms (left axis) and the ratio between the cost of the exported calorie and the imported calorie (right axis), that is, an approximation to the terms of trade measured in calories.
The trend observed in the figure is an increase in the cost of exported calories of 47% in the period, but a much higher increase in the cost of imported calories over time (more than 400%), which implied a deterioration of the terms of trade measured in calories, with a decrease of more than 250% in the period analyzed. Thus, Ecuador is feeding the rest of the world at a lower relative cost over time, despite the recent boom in commodity prices experienced worldwide.
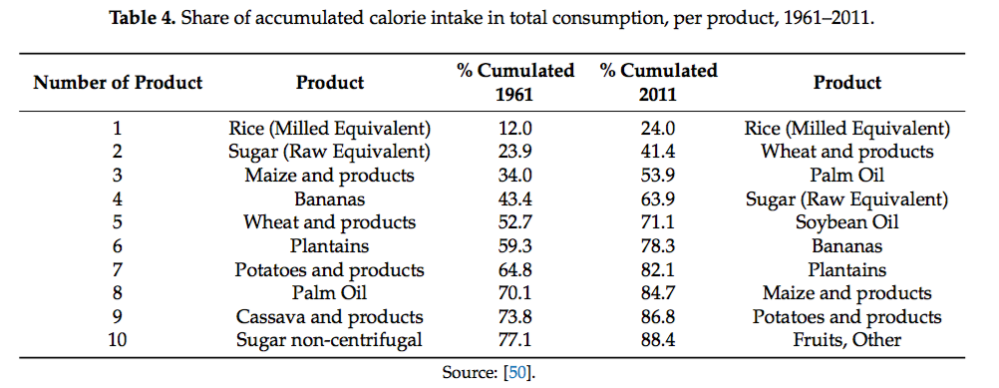
Our research also shows the degree of concentration of consumption in a few products, measured in kcal, comparing 1961 and 2011 (see Table 4). This high concentration in a few products did worsen in the period. Table 4 presents the cumulative calorie intake per product in year 1961 and 2011. The number represents the ranking of that product in both years, for instance, sugar was the second product in caloric terms in 1961 but the fourth in 2011. The table reads like this: in 1961 rice represented 12% of calorie intake, and rice plus sugar 23.9%, and so on. In the year 2011, rice represented 24%, while rice and wheat 41.4%, and so on. Five products (rice, sugar, maize, banana and wheat) represented 52.7% of calorie intake in 1961, while the share went up to 71.1% in 2011 (with a change in composition: rice, wheat, palm oil, sugar, soybean oil). When extending to 10 products, they represented 77.1% of consumption in 1961 and 88.4% in 2011. Therefore, apart from a change in the diet, with a noticeable increase in vegetable oils (soybean and palm) and a decrease in beans, cassava and potatoes, a large fraction of consumption is concentrated in a very small number of products and this concentration is increasing over time, reducing the variety of the diet in the country.
Supplementary materials: The following are available online at www.mdpi.com/2071-1050/9/11/2068/s1, Table S1: CUEE Data.xlsx which includes all the data and references for both figures and tables in the paper.
