Parra, R., Di Felice, L.J., Giampietro, G., Ramos-Martin, J. (2018): The metabolism of oil extraction: A bottom-up approach applied to the case of Ecuador”, Energy Policy, Vol. 122: 63-74. https://doi.org/10.1016/j.enpol.2018.07.017
Free download before September 9, 2018: https://authors.elsevier.com/c/1XQVW14YGgXhLw
 Abstract: The global energy system is highly dependent on fossil fuels, which covered approximately 90% of primary energy sources in 2016. As the quality and quantity of oil extracted changes, in response to changes in end uses and in response to biophysical limitations, it is important to understand the metabolism of oil extraction – i.e. the relation between the inputs used and the output extracted. We formalize a methodology to describe oil extraction based on the distinction between functional and structural elements, using the Multi-Scale Integrated Analysis of Societal and Ecosystem Metabolism (MuSIASEM) to generate a diagnostic of the performance of oil extraction and to build scenarios. The analysis allows generating modular benchmarks which are applicable to other countries. It is shown that oil extraction in Ecuador consumes, per cubic meter of crude oil extracted, over 100 kWh of electricity and 1.5 GJ of fuels, requiring 3 kW of power capacity and 2 h of human activity. A scenario is developed to check the effects on Ecuador’s metabolic pattern of an increase in oil production over the next five years. The strength of the proposed methodology is highlighted, focusing on the adaptability of the method for dealing with policy issues.
Keywords: Oil extraction, MuSIASEM, Ecuador, Metabolism, Complexity
JEL Codes: Q02, Q35, Q41, Q57
Despite efforts to reduce greenhouse gas (GHG) emissions and to shift towards a renewable energy system, oil remains an essential part of the global energy chain, with 3820 Mtoe consumed in 2015, out of a total final energy consumption of 9383 Mtoe (International Energy Agency, 2017). This is partly due to the fact that most renewable systems propose an alternative to electricity, rather than fuels. With sustainability issues tied to biofuels, particularly due to concerns over land use in relation to food security (Rathmann et al., 2010), as well as their low energetic output (Rajagopal et al., 2007), it is unlikely that conventional fuels will be phased out in the near future. Given the huge role that oil plays in societies, it is important to understand its metabolism – intended here as the interaction of internal factors determining the relation between the profile of inputs and outputs – particularly in relation to the internal consumption of energy carriers and other flows and funds (see Section 3.1 for a definition), such as water, chemicals, power capacity and human activity.
The aim of the paper is two-fold: on one hand, to develop methodological tools allowing us to describe the oil extraction process by accounting for various flows and funds across different levels; on the other, to apply the methodology to the case of Ecuador, both characterizing the factors determining the current metabolism and developing a scenario for future extraction and policy.
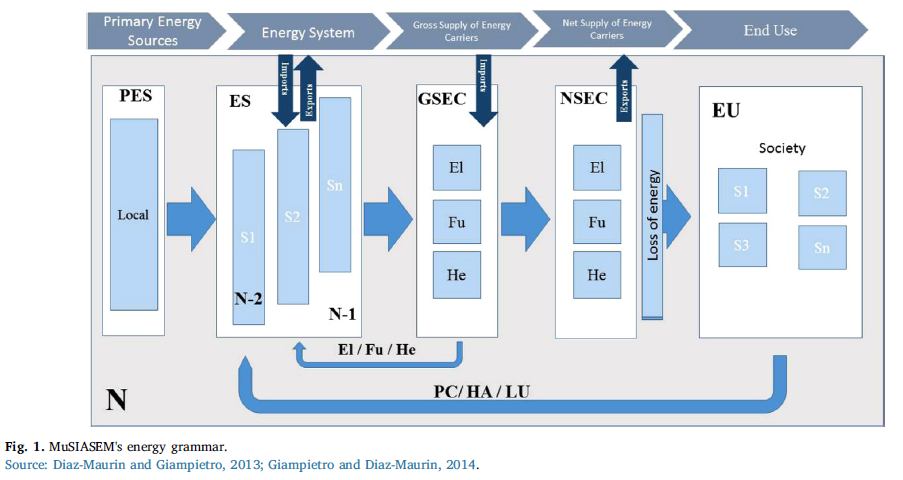
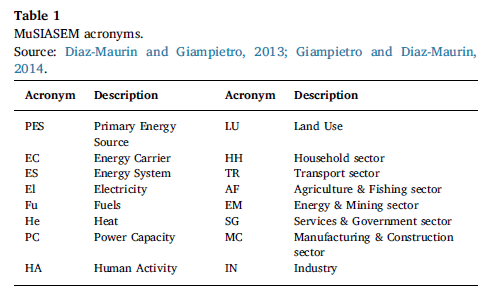
The MuSIASEM energy grammar has been described and applied in detail – see, for example, Velasco-Fernandez et al. (2015) and Giampietro et al. (2014). Its two main concepts, essential to understand the proposed analysis, are the distinction between primary energy sources (PES) and energy carriers (EC), and the disaggregation between mechanical energy (electricity) and thermal energy (heat and fuels). Fig. 1 shows the formalization of MuSIASEM’s energy grammar. A list of the acronyms introduced in Fig. 1, and used throughout the paper, is also provided in Table 1.
Recent developments in MuSIASEM have seen the introduction of a new conceptual tool called processor (Giampietro, 2018; González-López and Giampietro, 2017; Ripa and Giampietro, 2017; Ripoll-Bosch and Giampietro, 2017), whose aim is to describe the inputs and outputs of flows and funds of a certain process linking it with processes both at the same level and across different levels. Fig. 2 shows an example of a sequential pathway of processors for the fuel chain, starting from oil extraction and ending with transport of fuels to society. Here, the output of one processor becomes an input for the next, and each processor fulfilling a certain function (e.g. “oil extraction”) can be mapped
onto different structural processors. Each processor is characterized by a profile of inputs and outputs. Inputs coming from society (produced by processes under human control) are represented at the top of the processor. The useful output, either fulfilling a function for a following processor or being used by society, is represented by the arrow exiting the processor on the right. Inputs from the ecosystem (blue arrows) and outputs to the ecosystem, such as emissions (yellow arrows), are represented at the bottom.
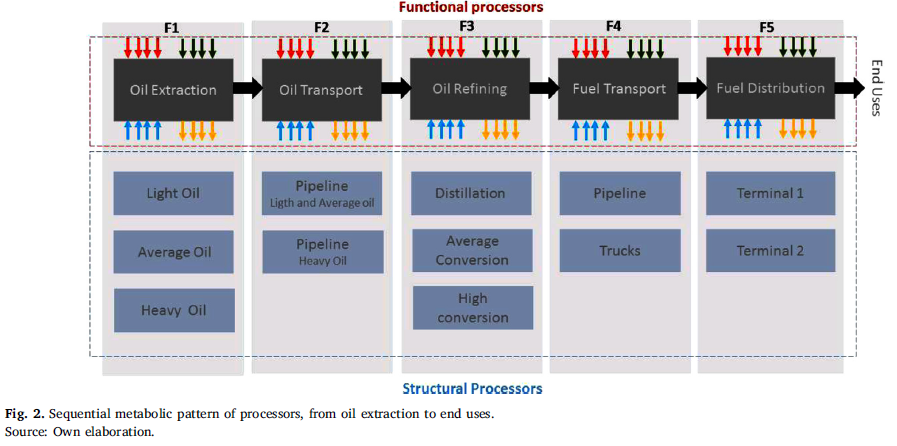
Structural processors describe a process taking place through a specific technology or method, for example oil extraction with deep sea drilling. The characteristics of these processors reflect the technical coefficients determined by the organizational structure of the plant carrying out the process. Functional processors, on the other hand, describe notional elements of a process whose aim is to provide a function within a wider system: for example, fuel refined for the transport system. The characteristics of these processors are defined by the function that has to be expressed to stabilize the metabolism of the larger whole. Theoretical ecology explains the notional definition of a functional processor in terms of mutual information – i.e. a metabolic network (i.e. an ecosystem) defines a virtual image of the metabolic characteristics of the node (network niche) which is independent of the actual characteristics of the metabolic element of the node (Ulanowicz, 1986).
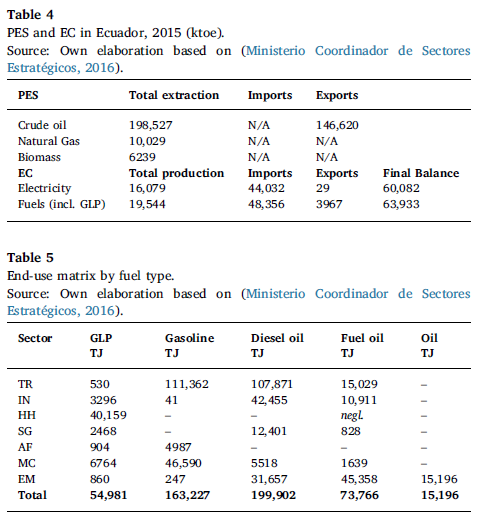
Table 4 shows an overview of Ecuador’s energy system, focusing on primary energy sources (PES) and energy carriers (EC), including imports and exports. As data for 2016 is not available yet, data for 2015 was used, taken from Ecuador’s annual energy balance, published by the Ministry of Strategic Sectors (Ministerio Coordinador de Sectores Estratégicos, (Ministerio Coordinador de Sectores Estratégicos, 2016)). Oil accounts for almost 90% of the primary energy mix. However, due to a lack of refining capacity, Ecuador is a net exporter of crude oil and net importer of refined fuels.
Leaving electricity aside and focusing on fuels, Table 5 shows the final consumption of fuels by societal sub-sectors, splitting them into GLP, diesel oil, fuel oil and gasoline. The disaggregation of both different fuels and of different societal compartments is needed to characterize end uses and to be able to have a complete overview not only of what is being produced, but also of how and where it is being consumed.
Looking at Ecuador’s 2016 metabolic pattern for oil extraction, we can see that:
– On average, over 100 kWh of electricity are needed for each cubic meter of crude oil extracted;
– Approximately 1.5 GJ of fuels are consumed for each cubic meter of crude oil extracted: most of them (1.3 GJ) are used to generate electricity on site, and the rest to operate machinery;
– As for funds, approximately 0.032 kW of power capacity are needed for each cubic meter of crude oil extracted; and 2 h of human activity, including both direct (operational) and indirect (administrative) jobs;
– Considering water use, almost 8m3 of fluid (water, gas and oil) are extracted for each cubic meter of oil recovered – 0.2m3 of freshwater are consumed per unit of extraction, and almost 6m3 of water are reinjected;
– Finally, the oil extraction step contributes to overall CO2 emissions by producing almost 84 kg of CO2 per cubic meter of oil extracted.
This framework is useful for two purposes. Firstly, it allows us to have a detailed description of the flows and the funds consumed by Ecuador’s oil extraction sector, as briefly outlined, identifying the relevant elements of the system. Given the lack of data on this step of the fuel chain, the metabolic description is valuable for energy analyses.
Secondly, the characterization of these elements in the form of processors allows checking how the combination of various elements of the oil extraction process contributes to its final metabolism, and how changing the relative weight of the elements affects the flows and funds of the final oil extraction processor, as will be seen in the next subsection.
The results for Ecuador showed that currently medium oil dominates the market, and that at the moment the extraction process on average requires, per cubic meter of oil extracted, over 100 kWh of electricity, 1.5 GJ of fuels, 3 kW of power capacity, 2 h of human activity and 6.2m3 of freshwater, of which 6m3 are reinjected. The extraction process also generates, per cubic meter of oil extracted, almost 85 kg of CO2 emissions. The package of indicators that are generated by the approach allows providing an integrated assessment of the performance of the investigated process in the form of a multi-criteria analysis. For example: (i) the profile of inputs of energy carriers (electricity, and fuels) are relevant for calculating the Energy Return on the Energy Investment (mapping both on the speed of depletion of the stock of resources and on emissions of CO2 per net supply); (ii) the requirement of power capacity (technology) is an indicator relevant for assessing the fixed economic costs; (iii) the requirement of labor is relevant both for assessing the economic costs and the opportunity for employment; (iv) the information about freshwater and CO2 emissions is relevant for an
analysis of environmental impact. Future work will focus on organizing this information in the form of a Multi-Criteria Analysis in order to make it available to decision makers in the form of a decision support system.
The analysis of the proposed scenario showed that extraction of new oil resources in Ecuador will shift from medium to heavy oil, but as this will be done mostly within newer blocks, less Base Sediment Water (BSW) will be produced in the process. This will lower the requirement of inputs per unit of oil produced. However, in order to provide a full overview of the overall effect on Ecuador’s oil extraction metabolism, a time dimension must be introduced in the analysis, checking how processors of the current oil extraction structures will change as they age in terms of flows and funds consumed. It is well known that, in general, older blocks consume more resources. This explains why the
simulated processor focusing only on the delta of increased production, based on the exploitation of new blocks, is less energy and water intensive than Ecuador’s 2016 real processor. Thus, the inclusion of a time dimension to the analysis is identified as a second area for further research.


