Actualización del déficit energético de España a Octubre de 2022

En septiembre de 2013 realicé un análisis de la factura energética de España. En septiembre de 2021 actualicé los datos hasta 2020 en esta entrada. Más abajo se encuentra el análisis para el año completo de 2021. Hoy, a 16 de diciembre de 2022, presento un avance de 2022 con datos hasta el mes de octubre.

Según datos de la Secretaría de Estado de Comercio (datos y fuentes se pueden consultar y descargar en el enlace de la figura) el déficit comercial se situó a finales de octubre en 60.289 millones de euros, de los que el déficit energético (importaciones netas de combustibles fósiles, básicamente) representó el 78%, o sea 47.109 millones de euros. Este es el valor más alto en toda la serie histórica que empieza en 1995 y de seguir así situaría el déficit de todo el año en el entorno de los 56.000 millones de euros, cerca de un 5% de renta nacional que estaría saliendo del país para pagar la factura energética. Las perspectivas para el año 2023 son incluso peores, así que el país necesita urgentemente reducir su consumo de combustibles fósiles, lo cual va a tener impacto en los niveles de actividad económica. Hay que planificar la reducción en la disponibilidad de combustibles, incluyendo racionamientos y prohibiciones de algunos usos. Y por supuesto hay que informar a la población.

El análisis con datos completos anuales para 2021 se encuentra aquí abajo.

España continúa manteniendo una gran dependencia de los combustibles fósiles, que son importados y procesados en el país. Tras la reducción del déficit energético de 2019 (por la caída del valor de las importaciones) y de 2020 (motivado por la bajada en el consumo y en las importaciones por la brusca caída de la actividad económica derivada de la pandemia de la COVID-19), el déficit energético ha vuelto a subir en 2021, como se observa en la Figura 1.

Figura 1. Déficit energético de España (1995 – 2021)

Déficit energético en España, 1995-2021

Fuente: Los datos, fuentes y figuras se pueden descargar aquí.

Como podemos ver en la Figura 1, tras el déficit máximo de 45.043 millones de euros en 2012, éste fue mejorando hasta 2016, año en el que alcanzó los 20.136 millones de euros, para empeorar de nuevo en 2017 y 2018, cuando el déficit energético (línea azul, eje izquierdo) se situó en 28.906 millones de euros. En 2019 el déficit baja a los 26.432 millones de euros y, finalmente, en 2020 baja hasta los 16.162 millones de euros por la brusca caída de las importaciones debido a la bajada en la actividad económica. Esto cambia en 2021 cuando el déficit se sitúa en 27.013 millones de euros (un 2,25% del PIB), debido tanto al mayor volumen de energía consumido por la recuperación de la actividad económica, como a la evolución al alza de los precios de importación.

En términos relativos, se puede destacar que el déficit energético en relación al PIB (línea negra, eje derecho) siempre fue una fracción del déficit comercial como porcentaje del PIB (línea roja, eje derecho), hasta el año 2011 en que la totalidad del déficit comercial se debió al déficit energético. En el período 2017-2019, el déficit energético explica más del 90% del déficit comercial, mientras que desde 2020 el déficit energético vuelve a ser superior al déficit comercial, representando en 2021 un 103% del déficit comercial. Esto quiere decir que las ganancias de productividad y de cuota de mercado mundial de España se ven lastradas por el déficit energético, que implica una salida de divisas continua del país. Dicho de otra manera, sin déficit energético, España tendría superávit comercial.

La relación estrecha entre crecimiento del PIB y consumo de energía, junto a la evolución al alza del precio de los combustibles fósiles, explican que, según los datos de comercio exterior del Ministerio de Industria, Comercio y Turismo, el déficit energético se haya situado ya en 47.109 millones de euros en octubre de 2022. La guerra en Ucrania y la creciente escasez de combustibles a nivel mundial hacen presagiar que este año el déficit será mucho más alto todavía, drenando una parte muy importante de la renta nacional.

Factura energética de España (1995 – 2020)

En septiembre de 2013 realicé un análisis de la factura energética de España, del que este artículo pretende ser una actualización. España mantiene una gran dependencia de los combustibles fósiles, que son importados y procesados en el país. A pesar de la reducción en el consumo experimentada desde el año 2007, el déficit energético alcanzó su máximo en 2012, con un valor de 45.043 millones de euros. A pesar de la mejora desde entonces, en 2017 vuelve a repuntar, ligado a la evolución económica del país, pues el crecimiento económico va íntimamente ligado al consumo de energía, de la que los combustibles fósiles son la mayoría. En 2019, antes de la actual pandemia Covid19, empieza a bajar el déficit de nuevo, motivado por una caída en las importaciones, que se acentúa en 2020 por la brusca caída de la actividad.

Figura 1. Factura energética de España (1995 – 2020)

Factura energética en España, 1995-2020

Fuente: Los datos, fuentes y figuras se pueden descargar aquí.

Como podemos ver en la Figura 1, de 2012 a 2016 el déficit mejoró, alcanzando los 20.136 millones de euros en 2016, para empeorar de nuevo en 2017 y 2018, año en el que el déficit energético (línea azul, eje izquierdo) se situó en 28.906 millones de euros. En 2019 el déficit baja a los 26.432 millones de euros y, finalmente, en 2020 baja hasta los 16.162 millones de euros por la brusca caída de las importaciones debido a la bajada en la actividad económica. En términos relativos, se puede destacar que el déficit energético en relación al PIB (línea negra, eje derecho) siempre fue una fracción del déficit comercial como porcentaje del PIB (línea roja, eje derecho), hasta el año 2011 en que la totalidad del déficit comercial se debió al déficit energético.En el período 2017-2019, el déficit energético explica más del 90% del déficit comercial, mientras que en 2020, a pesar de la caída de la actividad económica y de las importaciones de combustibles, el déficit energético vuelve a ser superior al déficit comercial, tendencia que probablemente continuará en 2021, por el encarecimiento de todos los combustibles fósiles que se está experimentando. Esto quiere decir que las ganancias de productividad en España y de cuota de mercado mundial, se ven lastradas por el déficit energético, que implica una salida de divisas continua del país. Dicho de otra manera, sin déficit energético, España tendría superávit comercial.

Figura 2. Consumo total de petróleo y per capita en España (1995 – 2020)

Consumo de petróleo total (Mtoe) y per capita (bbl_pc), España, 1995-2020

Fuente: ver Figura 1

El déficit energético implica que el país se está empobreciendo y está transfiriendo renta a los países exportadores de los que dependemos. Quizás de esta manera podamos entender mejor la presencia cada vez mayor de empresas rusas y del Golfo Pérsico en nuestro país.

Si miramos la Figura 2 podemos observar que el consumo de petróleo, que alcanzó su nivel máximo en 2007, empezó a bajar en términos absolutos y motivado por la crisis económica hasta el año 2014, en el que tuvo un valor casi idéntico al del año 1995. Desde entonces, y hasta 2019, ha aumentado ligeramente, pero manteniéndose por debajo de los valores de 1998. El año 2020, por la crisis económica inducida por la pandemia de Covid19, el consumo bajó a niveles inferiores a los observados en 1993, no graficados aquí, pero disponibles en las fuentes originales de datos.

En términos de consumo de petróleo por habitante, destaca que el máximo se produjo en 2004, con 12,33 barriles por persona. Este valor se redujo hasta el año 2014, con 8,5 barriles por persona. Desde 2015 y hasta 2019 ha vuelto a subir ligeramente, situándose en 9,17 barriles por persona en 2019, para caer nuevamente en 2020 hasta los 7,47 barriles por persona, por debajo del consumo por habitante de 1995, el inicio de la serie.

La estrecha relación entre crecimiento económico y consumo de energía implica que un mayor nivel de actividad económica implicará irremediablemente un mayor consumo de energía, que a precios mayores de los combustibles fósiles, no hará otra cosa que aumentar nuestro ya elevado déficit energético. Esto quiere decir que el país tendrá cada año menos renta disponible para el resto de usos: consumo e inversión privados y gasto público, y que estaremos transfiriendo cada año más renta a los países exportadores de combustibles fósiles. En resumen, creceremos para pagar cada vez más por la energía necesaria para ese crecimiento, y no nos beneficiaremos de ese crecimiento en términos de más puestos de trabajo o de mejores niveles de vida material.

Ante esta situación solo cabe la adaptación. Dado que la energía será más cara, si no queremos ser más pobres todavía tendremos que reducir su consumo, de ahí que sea vital la electrificación (renovable) de la economía y las medidas de ahorro y eficiencia energética. Ahora bién, esta reducción tampoco es gratis e implicará que algunos bienes y servicios que hasta hace poco eran considerados como accesibles pueden dejar de serlo, como los viajes y muchas otras actividades de ocio. Hay que afrontar de manera decidida el cambio necesario y planificar nuestra transición a un modelo que estará caracterizado por una menor disponibilidad de energía y a un coste mayor.

The metabolism of oil extraction: A bottom-up approach applied to the case of Ecuador

Parra, R., Di Felice, L.J., Giampietro, G., Ramos-Martin, J. (2018): The metabolism of oil extraction: A bottom-up approach applied to the case of Ecuador”, Energy Policy, Vol. 122: 63-74. https://doi.org/10.1016/j.enpol.2018.07.017

Free download before September 9, 2018: https://authors.elsevier.com/c/1XQVW14YGgXhLw

enpol2018Abstract: The global energy system is highly dependent on fossil fuels, which covered approximately 90% of primary energy sources in 2016. As the quality and quantity of oil extracted changes, in response to changes in end uses and in response to biophysical limitations, it is important to understand the metabolism of oil extraction – i.e. the relation between the inputs used and the output extracted. We formalize a methodology to describe oil extraction based on the distinction between functional and structural elements, using the Multi-Scale Integrated Analysis of Societal and Ecosystem Metabolism (MuSIASEM) to generate a diagnostic of the performance of oil extraction and to build scenarios. The analysis allows generating modular benchmarks which are applicable to other countries. It is shown that oil extraction in Ecuador consumes, per cubic meter of crude oil extracted, over 100 kWh of electricity and 1.5 GJ of fuels, requiring 3 kW of power capacity and 2 h of human activity. A scenario is developed to check the effects on Ecuador’s metabolic pattern of an increase in oil production over the next five years. The strength of the proposed methodology is highlighted, focusing on the adaptability of the method for dealing with policy issues.

Keywords: Oil extraction, MuSIASEM, Ecuador, Metabolism, Complexity

JEL Codes: Q02, Q35, Q41, Q57

Despite efforts to reduce greenhouse gas (GHG) emissions and to shift towards a renewable energy system, oil remains an essential part of the global energy chain, with 3820 Mtoe consumed in 2015, out of a total final energy consumption of 9383 Mtoe (International Energy Agency, 2017). This is partly due to the fact that most renewable systems propose an alternative to electricity, rather than fuels. With sustainability issues tied to biofuels, particularly due to concerns over land use in relation to food security (Rathmann et al., 2010), as well as their low energetic output (Rajagopal et al., 2007), it is unlikely that conventional fuels will be phased out in the near future. Given the huge role that oil plays in societies, it is important to understand its metabolism – intended here as the interaction of internal factors determining the relation between the profile of inputs and outputs – particularly in relation to the internal consumption of energy carriers and other flows and funds (see Section 3.1 for a definition), such as water, chemicals, power capacity and human activity.

The aim of the paper is two-fold: on one hand, to develop methodological tools allowing us to describe the oil extraction process by accounting for various flows and funds across different levels; on the other, to apply the methodology to the case of Ecuador, both characterizing the factors determining the current metabolism and developing a scenario for future extraction and policy.

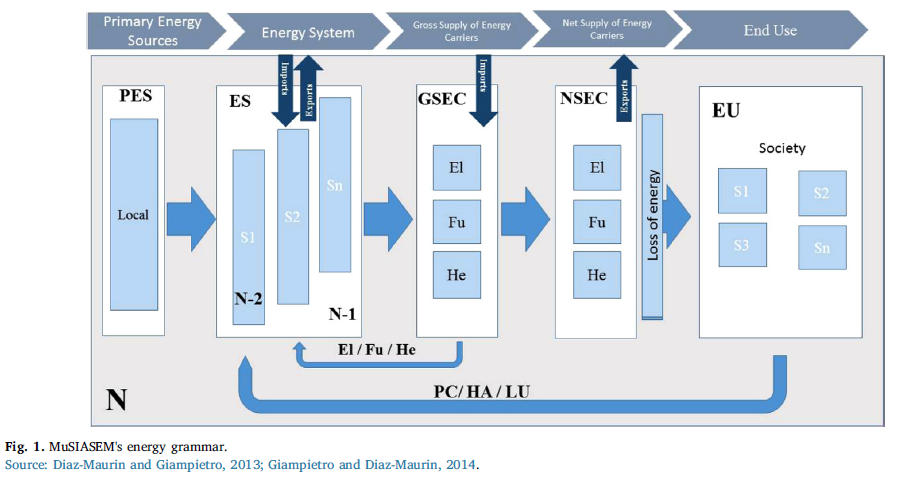
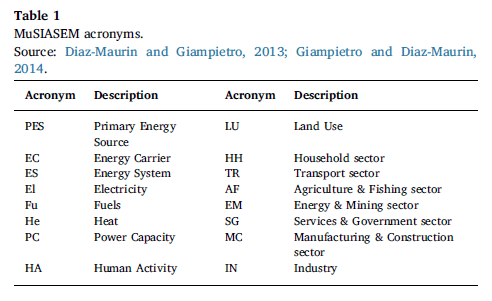
The MuSIASEM energy grammar has been described and applied in detail – see, for example, Velasco-Fernandez et al. (2015) and Giampietro et al. (2014). Its two main concepts, essential to understand the proposed analysis, are the distinction between primary energy sources (PES) and energy carriers (EC), and the disaggregation between mechanical energy (electricity) and thermal energy (heat and fuels). Fig. 1 shows the formalization of MuSIASEM’s energy grammar. A list of the acronyms introduced in Fig. 1, and used throughout the paper, is also provided in Table 1.

Fig1

Tab1

Recent developments in MuSIASEM have seen the introduction of a new conceptual tool called processor (Giampietro, 2018; González-López and Giampietro, 2017; Ripa and Giampietro, 2017; Ripoll-Bosch and Giampietro, 2017), whose aim is to describe the inputs and outputs of flows and funds of a certain process linking it with processes both at the same level and across different levels. Fig. 2 shows an example of a sequential pathway of processors for the fuel chain, starting from oil extraction and ending with transport of fuels to society. Here, the output of one processor becomes an input for the next, and each processor fulfilling a certain function (e.g. “oil extraction”) can be mapped
onto different structural processors. Each processor is characterized by a profile of inputs and outputs. Inputs coming from society (produced by processes under human control) are represented at the top of the processor. The useful output, either fulfilling a function for a following processor or being used by society, is represented by the arrow exiting the processor on the right. Inputs from the ecosystem (blue arrows) and outputs to the ecosystem, such as emissions (yellow arrows), are represented at the bottom.

Fig2

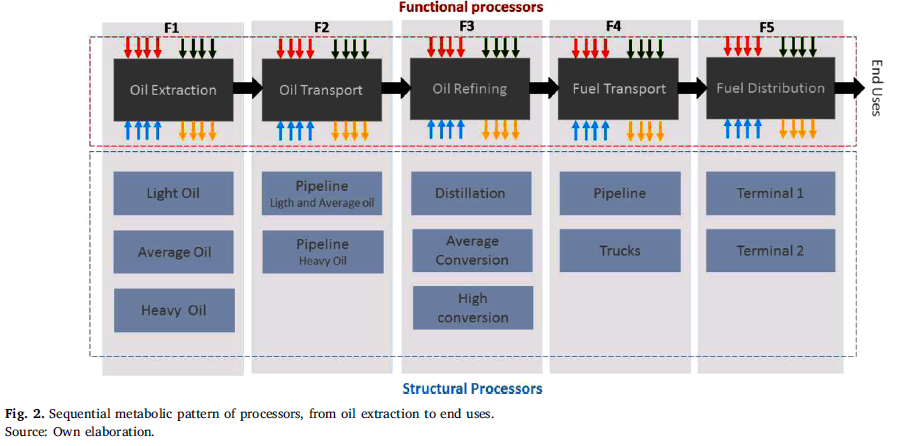
Structural processors describe a process taking place through a specific technology or method, for example oil extraction with deep sea drilling. The characteristics of these processors reflect the technical coefficients determined by the organizational structure of the plant carrying out the process. Functional processors, on the other hand, describe notional elements of a process whose aim is to provide a function within a wider system: for example, fuel refined for the transport system. The characteristics of these processors are defined by the function that has to be expressed to stabilize the metabolism of the larger whole. Theoretical ecology explains the notional definition of a functional processor in terms of mutual information – i.e. a metabolic network (i.e. an ecosystem) defines a virtual image of the metabolic characteristics of the node (network niche) which is independent of the actual characteristics of the metabolic element of the node (Ulanowicz, 1986).

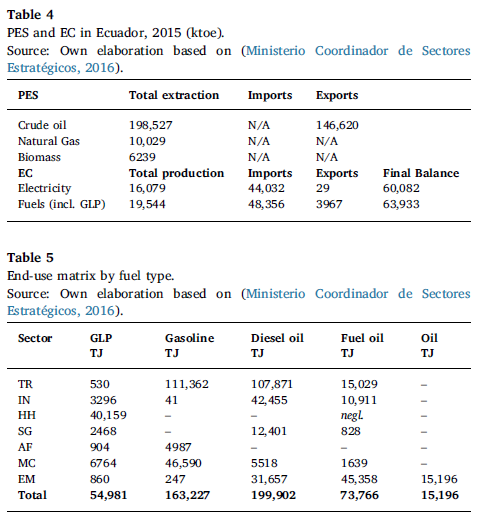
Table 4 shows an overview of Ecuador’s energy system, focusing on primary energy sources (PES) and energy carriers (EC), including imports and exports. As data for 2016 is not available yet, data for 2015 was used, taken from Ecuador’s annual energy balance, published by the Ministry of Strategic Sectors (Ministerio Coordinador de Sectores Estratégicos, (Ministerio Coordinador de Sectores Estratégicos, 2016)). Oil accounts for almost 90% of the primary energy mix. However, due to a lack of refining capacity, Ecuador is a net exporter of crude oil and net importer of refined fuels.

Leaving electricity aside and focusing on fuels, Table 5 shows the final consumption of fuels by societal sub-sectors, splitting them into GLP, diesel oil, fuel oil and gasoline. The disaggregation of both different fuels and of different societal compartments is needed to characterize end uses and to be able to have a complete overview not only of what is being produced, but also of how and where it is being consumed.

Tab4

Looking at Ecuador’s 2016 metabolic pattern for oil extraction, we can see that:
– On average, over 100 kWh of electricity are needed for each cubic meter of crude oil extracted;
– Approximately 1.5 GJ of fuels are consumed for each cubic meter of crude oil extracted: most of them (1.3 GJ) are used to generate electricity on site, and the rest to operate machinery;
– As for funds, approximately 0.032 kW of power capacity are needed for each cubic meter of crude oil extracted; and 2 h of human activity, including both direct (operational) and indirect (administrative) jobs;
– Considering water use, almost 8m3 of fluid (water, gas and oil) are extracted for each cubic meter of oil recovered – 0.2m3 of freshwater are consumed per unit of extraction, and almost 6m3 of water are reinjected;
– Finally, the oil extraction step contributes to overall CO2 emissions by producing almost 84 kg of CO2 per cubic meter of oil extracted.

This framework is useful for two purposes. Firstly, it allows us to have a detailed description of the flows and the funds consumed by Ecuador’s oil extraction sector, as briefly outlined, identifying the relevant elements of the system. Given the lack of data on this step of the fuel chain, the metabolic description is valuable for energy analyses.

Secondly, the characterization of these elements in the form of processors allows checking how the combination of various elements of the oil extraction process contributes to its final metabolism, and how changing the relative weight of the elements affects the flows and funds of the final oil extraction processor, as will be seen in the next subsection.

The results for Ecuador showed that currently medium oil dominates the market, and that at the moment the extraction process on average requires, per cubic meter of oil extracted, over 100 kWh of electricity, 1.5 GJ of fuels, 3 kW of power capacity, 2 h of human activity and 6.2m3 of freshwater, of which 6m3 are reinjected. The extraction process also generates, per cubic meter of oil extracted, almost 85 kg of CO2 emissions. The package of indicators that are generated by the approach allows providing an integrated assessment of the performance of the investigated process in the form of a multi-criteria analysis. For example: (i) the profile of inputs of energy carriers (electricity, and fuels) are relevant for calculating the Energy Return on the Energy Investment (mapping both on the speed of depletion of the stock of resources and on emissions of CO2 per net supply); (ii) the requirement of power capacity (technology) is an indicator relevant for assessing the fixed economic costs; (iii) the requirement of labor is relevant both for assessing the economic costs and the opportunity for employment; (iv) the information about freshwater and CO2 emissions is relevant for an
analysis of environmental impact. Future work will focus on organizing this information in the form of a Multi-Criteria Analysis in order to make it available to decision makers in the form of a decision support system.

The analysis of the proposed scenario showed that extraction of new oil resources in Ecuador will shift from medium to heavy oil, but as this will be done mostly within newer blocks, less Base Sediment Water (BSW) will be produced in the process. This will lower the requirement of inputs per unit of oil produced. However, in order to provide a full overview of the overall effect on Ecuador’s oil extraction metabolism, a time dimension must be introduced in the analysis, checking how processors of the current oil extraction structures will change as they age in terms of flows and funds consumed. It is well known that, in general, older blocks consume more resources. This explains why the
simulated processor focusing only on the delta of increased production, based on the exploitation of new blocks, is less energy and water intensive than Ecuador’s 2016 real processor. Thus, the inclusion of a time dimension to the analysis is identified as a second area for further research.

Livelihood sustainability assessment of coffee and cocoa producers in the Amazon region of Ecuador using household types

Viteri Salazar, O., Ramos-Martin, J., Lomas, P.L. (2018): “Livelihood sustainability assessment of coffee and cocoa producers in the Amazon region of Ecuador using household types”, Journal of Rural Studies, Vol. 62: 1-9. https://doi.org/10.1016/j.jrurstud.2018.06.004

Free download until August 15, 2018: https://t.co/ZhyPNetmic

Screen Shot 2018-07-07 at 09.58.10

Abstract: Supporting small farmer livelihoods in fragile, biodiverse regions, such as tropical forests, is a priority for many development agencies and national governments. These regions tend to be characterized by recent human settlements, increasing populations and infrastructure development, as well as competitive land use activities, which exert pressure on fragile ecosystems. Improvement in livelihood strategies often focuses on increasing yields by improving productivity, but without taking into account alternative methods, such as better agricultural practices and their dependence on agrochemical inputs, changing land use through crop substitution, or improving product commercialization. In this research, we use household types, defined according to different land use patterns, in the Northern Amazon region of Ecuador to explore the limitations of, and identify future options for, improving livelihood strategies based on small-scale coffee and cocoa production. The results of the different types are discussed in order to highlight the methods’ utility and identify benefits in terms of environmental and social objectives versus economic profitability. Lessons are drawn that could be useful in applications of public policy aimed at the betterment of small coffee grower and cocoa farmer livelihood strategies, which involve thousands of families in the Amazon region of Ecuador, without compromising the environment.

Keywords: Household types, Amazon, Ecuador, Livelihoods, Coffee and cocoa, Sustainability

The main objective of this study is to contribute to the evaluation of agricultural production systems. This is done here by using a typology of four predominant production systems and comparing their performance against a set of indicators. A second objective is to inform decision makers about the differentiated outcomes these production systems have, so that tailored policy interventions can be designed based on the evaluation of past initiatives. In particular, this work focuses on: i) identifying the socioeconomic and environmental restrictions implicit in different land use patterns; ii) analysing how different land use patterns improve livelihoods in terms of income; and iii) identifying how certain public policies can lead to the establishment of particular types or lifestyles, thereby generating an impact on the income of small- scale producers.

After collecting the data, a typology of households was established as a method of conceptualization and empirical analysis. Household types have been largely used as societal functional units of analysis within integrated assessments for rural systems (Pastore et al., 1999; Giampietro, 2003; Scheidel et al., 2013; Williams et al., 2015), as well as often employed to strengthen the focus of policies and interventions associated with rural livelihoods (Gomiero and Giampietro, 2001; Niehof and Price, 2001; Senthilkumar et al., 2009; Serrano-Tovar and Giampietro, 2014; Tittonell et al., 2010; Williams et al., 2015).

The characterization of types was made in terms of land use patterns and impacts upon the environment, whether through the use of synthetic inputs, the implementation of monocultures or the expansion of the agricultural frontier and the consequent reduction in the forested area. The classification of typologies was based on the technical data sheets suggested by the National Institute of Agricultural Research (Instituto Nacional de Investigaciones Agropecuarias), in terms of area, level of agrochemical use, crop combination, etc., with consideration given to these recommendations as thresholds.

One characteristic shared by the different types is the need for crops that guarantee a permanent inflow of cash. In all cases, apart from coffee and cocoa, there are “other crops” (plantain, maize, cassava, rice and fruit trees) that help in providing food security to households. The types defined include farmers who share at least one of the cash crops, as follows: Type 1 contains coffee and cocoa plantations (CC); Type 2 contains only cocoa cultivation (C); Type 3 comprises coffee, cocoa and oil palm plantations (CCP); and finally, Type 4 only has coffee farming (Cf).

Screen Shot 2018-07-07 at 10.10.00

Screen Shot 2018-07-07 at 10.10.14

Income from coffee and cocoa production represents about 19% of total household income for Types 1 and 2 despite their low yield, whereas it is only 8% for Types 3 and 4. Type 3 earns more from other crops and oil palm, while Type 4 receives the most from off-farm work, although production at the farm still plays a cultural and environmental role.

Under these circumstances, Type 4 performs very well in environmental terms (LIU and 24 ha of forest) and is very close to Type 2 in economic terms. Hence, there is a need to increase income via improving some agricultural practices (e.g., pruning), selecting plants and particularly changing to commercialization, thus making it possible for smallholders to move up the value chain. Unless measures supporting productive activity of this type are implemented, a shift towards Types 1 and 2 could be expected, or even worse towards Type 3 by means of selling or renting their land.

The analysis of the surplus generated by each type helps in identifying the reasons why households have chosen different productive patterns. It can be seen how cocoa has gradually replaced the cultivation of coffee. According to the Third National Agricultural Census (2000), 49,389 ha of coffee and 7751 ha of cocoa were present in the area, while, according to our study, there were 44,580 ha of cocoa and 9500 ha of coffee in 2013 (Fig. 2). This is consistent with our results, as Type 2 has a higher surplus than Type 1, which has the lowest surplus of all and depends largely on off-farm work for guaranteeing livelihood. Until 10 years ago, large-scale landowners dominated oil palm plantations. Only recently have smallholders engaged in oil palm production, thus giving rise to Type 3. Despite the fact that plantations are still young (four to eight years), they already show the highest surplus (US $144.63); however, from an environmental point of view, they are the least interesting of all, because they involve a HIU, with forest only covering 4% of land, and the number of families that have benefited from that is very low (4.5%). One can understand why private enterprises and even the central government are interested in this type (profits, but also greater GDP and taxes). However, this type also re- presents more environmental impacts and a greater degree of dependency for the households (a large fraction of their income is ex- pended in buying agrochemicals from the very same intermediaries who are commercializing palm oil). These reasons do not make this type, in our view, an option for future development.

Screen Shot 2018-07-07 at 10.13.31

Creating types for an analytical case study in one of the most important areas of the Ecuadorian Amazon, with highly biodiverse ecosystems and significant forest cover, allows for visualizing different land use patterns linked to economic resource generation as a means of subsistence. This behaviour is strongly linked to public policies being developed in the sector, where it is believed that oil palm monocultures could be a better alternative revenue source for farmers. However, as shown in Types 2 and 4, its utility is very similar to Type 3 (oil palm), but with a much lower dependence on intensive agrochemical use in the case of Type 2 and a practically null value in Type 4, which hardly uses agrochemical inputs. The differentiated performance of types should encourage the design of tailored interventions to address the problems encountered by each of them, promoting those types with less environmental impact, but which still provide the necessary means for livelihoods and incentives for the conversion of the types with more impact.

The intensity of land use, marked in large part by the expansion of the agricultural frontier and the reduction in forest cover on farms, is much lower in Type 4 than in the other types, making this form of production more desirable in environmental terms. However, this type shows a limitation in terms of income generation, as nearly 35% of its income comes from off-farm work performed by dayworkers. This aspect is important to consider in the development of agricultural programmes oriented toward jump-starting production, where time dedicated by farmers is an important variable, since this type would not have any time restrictions when either adopting a more labour-intensive agricultural practice or expanding the agricultural frontier. In contrast, Type 4 reflects the practical impossibility of adding crops to a farm, since agricultural use of the available land surface is found to be at 96% capacity.

Identifying the land use and economic income corresponding to types has also revealed the fact that Type 2 represents the lowest labour demand per hectare, an aspect that could be useful for pushing programmes focused on cocoa production, in which labour availability, on the one hand, and profitability per hectare for cocoa and coffee, on the other, should be analysed.

The concept of caloric unequal exchange and its relevance for food system analysis: The Ecuador case study

Ramos-Martin, J., Falconi, F., Cango, P. (2017): “The concept of caloric unequal exchange and its relevance for food system analysis: The Ecuador case study”, Sustainability, Vol 9(11), 2068. http://www.mdpi.com/2071-1050/9/11/2068/pdf 
http://dx.doi.org/10.3390/su9112068 

Sustainability2017

Abstract: The impact of food production patterns and food supply upon consumption patterns is usually explained by economies of scale and affordability. Less attention is given to food trade patterns and global insertion of economies affecting dietary changes. This paper contributes to the discussion using the concept of caloric unequal exchange that defines the deterioration of terms of trade in food in units of calories and complements studies on unequal exchange and ecologically unequal exchange. A new perspective to food systems’ analysis is achieved by using this concept. This paper uses the case study of Ecuador to exemplify its potentiality. Exports and imports to and from Ecuador are analyzed for the period 1988 through 2013 in volume, value, and calories, for different groups of products. The conclusion is that Ecuador is increasingly helping to feed the world, at a caloric cost that is decreasing over time. There is a deterioration of the terms of trade of traded food in terms of calories for Ecuador of more than 250% between 1986 and 2013.

Keywords: Latin America; caloric unequal exchange; terms of trade; food; Ecuador.

Changes in consumption patterns are usually referred to as being caused by changes in preferences in consumers or certain constraints, such as those of a budgetary nature. Acknowledging the relevance of demand-side determinants for consumption, we believe the role a country plays in international trade may also be a determinant. A country’s global positioning in trade, concentrated in certain products, may well induce changes in production patterns, which may have an effect, subsequently, on the domestic supply of food products. The traditional way we look at food systems, in terms of supply and demand, seems limited to us. Data in terms of volume and value may well be complemented with data on the relative cost to the calorie of both imports and exports, what we call caloric unequal exchange. In this way, we can have a different look to the concept of domestic availability which links to other concepts such as food sovereignty. The change in domestic availability (and very often affordability) may also induce changes in consumption patterns. With this consideration in mind, the aim of the paper is twofold: (1) to explore the existence of caloric unequal exchange for Ecuador as defined by a recent study; and (2) to explore the links between changes in food consumption patterns, international trade and domestic production of food products.

In order to respond to the two objectives of the paper, we use the recently introduced concept of caloric unequal exchange, defined as the deterioration in the terms of trade of food traded when considering the cost of exported and imported calories, and explained with detail in Section 2. The study originally introducing the concept focused on Latin America and the Caribbean as a block, showing that, even if calories exported were more expensive than those imported, there was a deterioration of the terms of trade since 1961 and the region was increasingly feeding the rest of the world at ever cheaper costs to the calorie. This went along with an increased volume (and value) of exports, making explicit the recent turn, to intensify the international insertion of the region as a provider of commodities to the rest of the world. This international insertion is seen by some as positive from an economic point of view. However, the impacts upon the environment in terms of soil deterioration, export of nutrients, and increased energy consumption and CO2 emissions from those exports, are still not clear as there are only a few studies that analyze the loss of nutrients involved in food exports.

The insertion of Ecuador in the world economy since then has suffered from two facts. On the one hand, the small scale of its economy prevents it from influencing world prices for commodities exported. On the other hand, the loss of monetary policy implied by dollarization prevented the country from using competitive devaluations for gaining market share. The outcome, for all products but particularly for food products, was an increase in volumes exported, as can be seen in Table 1 below.

Table1

Not only did Ecuador increase its exports, but its imports also rose after dollarization. The economy became very open to the global market. The openness index, a measure of the share of imports plus exports over GDP, went from 0.25 in 1965 to 0.57 in 2012, having reached a peak in the year 2008 with a value of 0.64. This vulnerability of the economy to the world markets, aggravated by the lack of industry in the country, implied an increase in food trade as well.

Table 1 presents the food trade balance (for the selected product groups) between Ecuador and the rest of the world for the period 1988 through 2013. Data is presented in volume, monetary value, and its conversion into calories. Exports in volume increased by 4.3 times their original size in the period, less than in terms of calories (5.3), whereas its monetary value increased by 7.9 times. In the case of imports, they increased by 2.1 times in terms of volume and calories, while they increased by 10.9 times in monetary terms.

During the 25-year period analyzed, Ecuador went from exporting double the amount of food that was imported in 1988 to exporting more than five times what was imported in 2013, in terms of volume. This is part of the re-primarization experienced by some of the Latin American economies.

Fig6

Deepening the data analysis shown in Table 1, Figure 6 presents the cost in US dollars of one million kcal exported and imported in real terms (left axis) and the ratio between the cost of the exported calorie and the imported calorie (right axis), that is, an approximation to the terms of trade measured in calories.

The trend observed in the figure is an increase in the cost of exported calories of 47% in the period, but a much higher increase in the cost of imported calories over time (more than 400%), which implied a deterioration of the terms of trade measured in calories, with a decrease of more than 250% in the period analyzed. Thus, Ecuador is feeding the rest of the world at a lower relative cost over time, despite the recent boom in commodity prices experienced worldwide.

Our research also shows the degree of concentration of consumption in a few products, measured in kcal, comparing 1961 and 2011 (see Table 4). This high concentration in a few products did worsen in the period. Table 4 presents the cumulative calorie intake per product in year 1961 and 2011. The number represents the ranking of that product in both years, for instance, sugar was the second product in caloric terms in 1961 but the fourth in 2011. The table reads like this: in 1961 rice represented 12% of calorie intake, and rice plus sugar 23.9%, and so on. In the year 2011, rice represented 24%, while rice and wheat 41.4%, and so on. Five products (rice, sugar, maize, banana and wheat) represented 52.7% of calorie intake in 1961, while the share went up to 71.1% in 2011 (with a change in composition: rice, wheat, palm oil, sugar, soybean oil). When extending to 10 products, they represented 77.1% of consumption in 1961 and 88.4% in 2011. Therefore, apart from a change in the diet, with a noticeable increase in vegetable oils (soybean and palm) and a decrease in beans, cassava and potatoes, a large fraction of consumption is concentrated in a very small number of products and this concentration is increasing over time, reducing the variety of the diet in the country.

Table4

Supplementary materials: The following are available online at www.mdpi.com/2071-1050/9/11/2068/s1, Table S1: CUEE Data.xlsx which includes all the data and references for both figures and tables in the paper.

Spatial assessment of the potential of renewable energy: the case of Ecuador

Cevallos, J., Ramos-Martin, J. (2018): “Spatial assessment of the potential of renewable energy: the case of Ecuador”. Renewable & Sustainable Energy Reviews, 81:1154-1165. Download at https://authors.elsevier.com/c/1Vg5A4s9Hvq8Xc

Screen Shot 2017-09-10 at 18.12.55
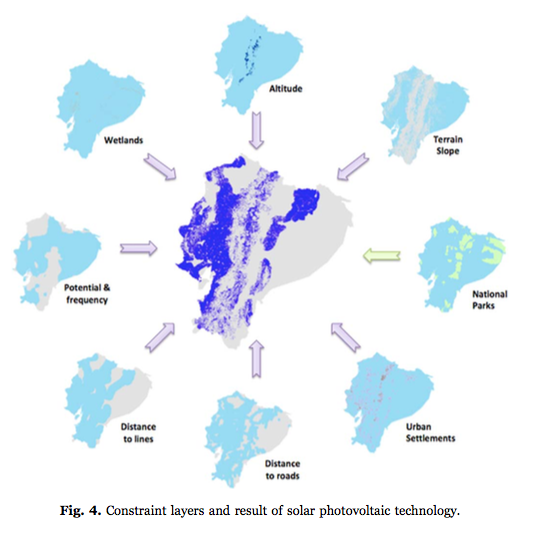
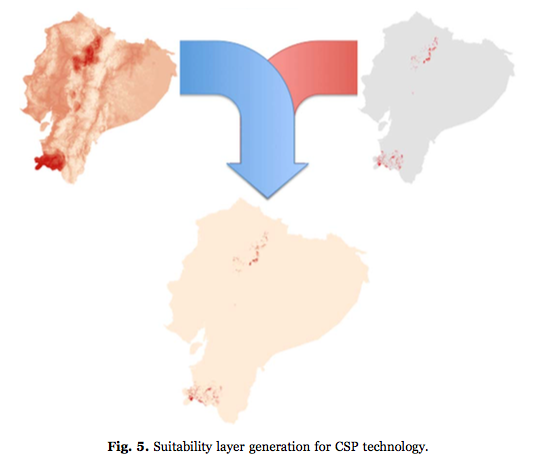
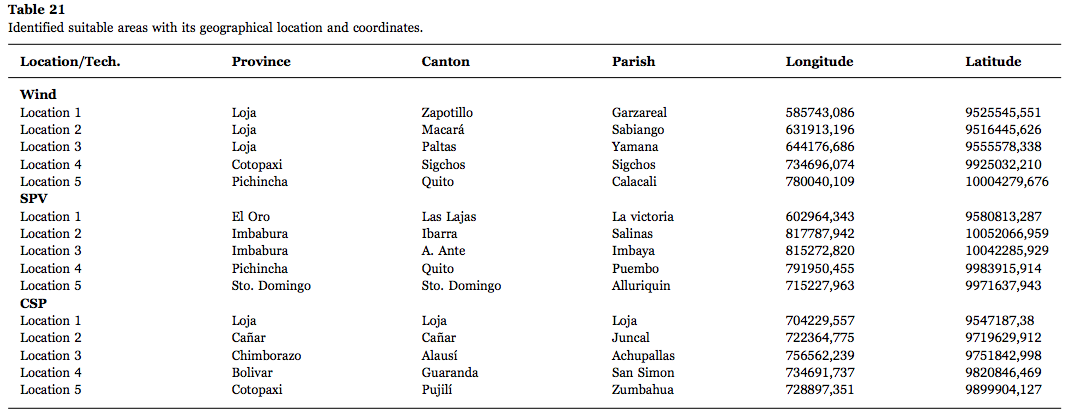
Abstract: Although renewable energy represents a large share of the electric energy generation sources in Latin America, non-conventional sources such as solar or wind energies have not represented a big share of their electric energy systems. The first step to promote the use of these sources in the region is identifying the potential of each energy source, task that can be estimated with the use of spatial tools such as Geographic Information Systems (GIS). This study has reviewed a large list of GIS publications to select a methodology to identify suitable areas for the development of non-conventional renewable energy projects (REP), in order to estimate the maximum energy these technologies could contribute to a national electric energy system, and its applied to the Republic of Ecuador. By using GIS, it is sought to identify the sites where potential renewable energy plants could be located, and initially recommends geographic locations for the installation of measuring towers of solar and wind resources, in order to obtain more detailed information on their behavior. As a result, the areas with higher potential for the development of REP have been identified, and classified in spatial layers according its technology and location. These results show that solar PV is the technology with most suitable areas in the country and demonstrate particularly large potential in two regions: the Andes cordillera and Insular region, especially in the provinces of Loja, Pichincha and the Galapagos islands.


Keywords: Renewable-energy, GIS, Ecuador, Multi-criteria analysis

This study focuses on the assessment of potential locations for the implementation of non-conventional renewable energy projects, in order to estimate the maximum theoretical amount of energy they could contribute to the Ecuadorean’s energy system. By using Geographic Information Systems (GIS) tools, this study seeks to identify suitable areas where NCRE power plants could potentially be sited and classifies the results by regions. The evaluation can be used as a starting point to select the best locations for the installation of resource measuring towers, in order to obtain detailed behavioral data from these sources.

Screen Shot 2017-09-10 at 18.18.32

Screen Shot 2017-09-10 at 18.18.44

Screen Shot 2017-09-10 at 18.18.52

Results show the provinces with the most suitable areas are located in the Andean and Insular regions. Here it can be observed that appropriate locations vary with each resource, however these are concentrated in only few provinces. The provinces of Loja, Pichincha, and Galapagos are the most benefited from the solar resource. It is in these provinces where optimal areas for implementation of SPV and CSP technologies are found. Provinces benefited with wind resources are distributed in the Andean region, however potential locations are limited to the provinces of Loja, Cañar, Chimborazo, Cotopaxi and Pichincha only.

Screen Shot 2017-09-10 at 18.21.15

Organizational structure and commercialization of coffee and cocoa in the northern Amazon region of Ecuador

Viteri-Salazar, O., Ramos-Martin, J. (2017): “Organizational structure and commercialization of coffee and cocoa in the northern Amazon region of Ecuador”, Revista NERA, Núcleo de Estudos, Pesquisas e Projetos de Reforma Agrária, Nro. 35: 266-287. Download http://revista.fct.unesp.br/index.php/nera/article/download/4895/3692

Screen Shot 2017-09-10 at 18.10.00
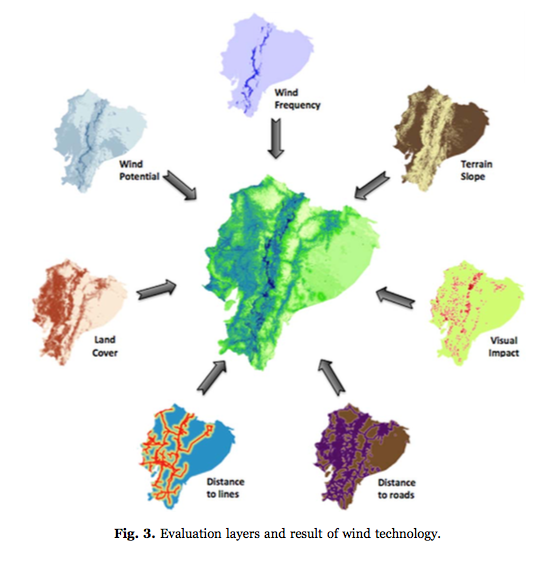
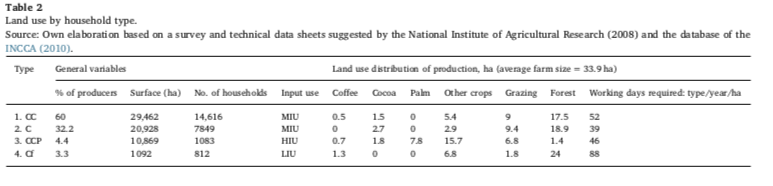
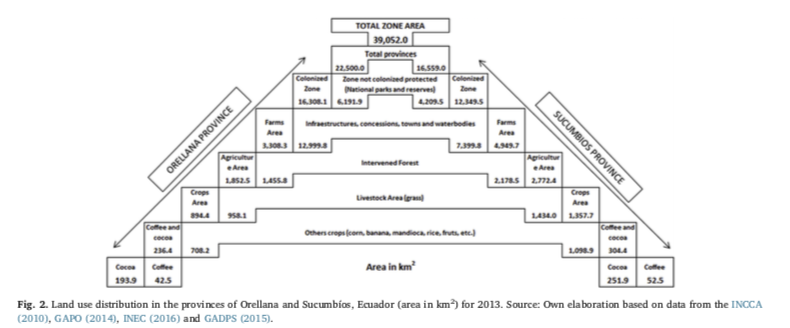
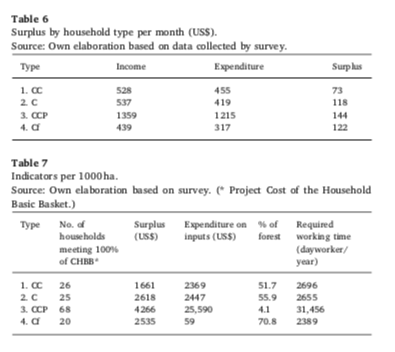
Abstract: The cultivation of coffee and cocoa is the main source of income for small farmers in the northern Amazon region in Ecuador. As border area, they have been beneficiaries of multiple public and private institutions, principality designed to reactivate the production of coffee and cocoa. The goal was to improve the quality of life of local population threatened by poverty and characterised by high level of immigration from Colombia. The current study was carried out to outline the main obstacles faced by producer associations in order to identify policy measures to address these. This study show data of organisational structure, initiatives for marketing under partnerships, and storage infrastructure with an estimate for the production of coffee and cocoa, based on primary and secondary information. It also implies that the government could play a bigger role supporting peasant organisations in different aspects like: capture of added value by peasants; associative commercialisation with a focus on a popular and solidary economy; and offering flexible credit. All of this would encourage participatory, sustainable rural business ventures. Finally, we present different alternatives for improve the implementation of public agricultural policies, about of organisational structure of the producers, commercialisation processes and environmental concerns.

Keywords: Amazon Region; associative commercialization; coffee-cocoa production; public policy.


Esta vez es diferente. La importancia de la energía explicada a expertos de otras áreas

Esta vez es diferente. La importancia de la energía explicada a expertos de otras áreas

Se replica aquí el breve artículo: Ramos-Martin, J. (2017): “Esta vez es diferente. La importancia de la energía explicada a expertos de otras áreas”, in Investigación y Ciencia n°487: 94-95, Abril 2017. Versión alternativa en html aquí, versión pdf aquí.

complexityEl libro Energy, complexity and wealth maximization («Energía, complejidad y maximización de la riqueza»), de Robert Ayres, es la última contribución de este gran científico al análisis energético, tan desaparecido de nuestras facultades. Junto con autores como James Kay o Tim Allen (ecología) o Vaclav Smil (sistemas energéticos), el trabajo de Bob Ayres se ha centrado no solo en analizar y explicar el papel de la energía en el origen de la vida y el funcionamiento de los sistemas naturales y humanos, sino en educar a profesionales de otras áreas en el rol crucial que desempeña la energía. Ese es precisamente el objetivo de este libro: explicar la importancia de la energía a personas formadas en otras ramas del conocimiento que, normalmente, no le prestan demasiada atención, como los economistas.

¿Por qué centrarse en los economistas? Porque, ante la pregunta inocente de un estudiante sobre dónde están los recursos naturales en la función de producción normalmente empleada en economía (la cual solo depende del capital K y del trabajo LY = Af(K,L), donde Y denota el PIB y Aes una variable que, en teoría, recoge el avance tecnológico), la respuesta de muchos profesores de materias como crecimiento económico es, simplemente, añadirlos a la función. Esto tiene el problema de obviar que la producción y la reproducción tanto del capital como del trabajo necesitan recursos naturales: un error repetido por economistas de prestigio como Joseph Stiglitz o Robert Solow. El libro aborda estos problemas desde la perspectiva de los sistemas complejos, las redes ecológicas y la termodinámica de sistemas fuera del equilibrio para mostrar la importancia de la energía en la evolución de los sistemas naturales y sociales, [véase «Economía biofísica», por Jesús Ramos Martín; Investigación y Ciencia, junio de 2012].

La obra se divide en tres partes. La primera se centra en definir conceptos fundamentales, como entropía y «exergía» (o energía útil), así como en analizar el papel de la energía en la creación del universo, el origen de la vida y el funcionamiento del sistema terrestre y los ciclos que lo regulan. La segunda presenta la importancia de la energía en el avance de la ciencia y la técnica, abordando incluso las limitaciones en términos tecnológicos de la actual dependencia del petróleo como recurso agotable. Por último, la tercera recoge desde la visión de la economía ortodoxa hasta las tesis que hoy comparten ecólogos, economistas ecológicos y otros científicos con respecto a la relación entre la disponibilidad y uso de energía y la generación de riqueza material, así como los desafíos que encontramos en una sociedad fuertemente dependiente de los recursos fósiles. El libro termina con una serie de apéndices orientados a profundizar en la modelización de la energía para explicar el crecimiento económico, y en cómo los límites de los recursos no se ciñen a la energía, sino también a la disponibilidad de materiales. Como decía Georgescu-Roegen, la materia también importa (matter matters, too!).

La energía, dice el autor, es la esencia de toda sustancia. La energía útil, o exergía, es la que permite la creación y condensación de la materia y los recursos, pero también la que hace mover el aparato industrial que transforma esos recursos en bienes y servicios que satisfacen las necesidades humanas: el «metabolismo biofísico» del que hablaba Georgescu-Roegen. Sin gradientes de energía disponible no hay evolución de los sistemas.

La evolución prima a los individuos, ecosistemas y sociedades que son capaces de procesar un mayor volumen de recursos, en la línea de lo apuntado por Howard Odum. Son estos gradientes de recursos disponibles los que permiten que las sociedades evolucionen hacia formas cada vez más complejas, con mayor cantidad de estructuras y con una mayor interacción entre individuos. Es decir, una ciudad resulta más compleja que una comunidad de cazadores-recolectores precisamente porque cuenta con una mayor disponibilidad de recursos.

Para numerosos economistas, como Stiglitz y Solow, el conocimiento constituye una especie de nuevo recurso que explica la mejora de la productividad y la creación de riqueza. Sin embargo, no tienen en cuenta la base material de ese conocimiento. La información y el conocimiento resultan baratos de reproducir pero costosos de producir. La generación de conocimiento requiere estructuras (universidades y centros de investigación) y mano de obra dedicada, cuyo mantenimiento consume importantes cantidades de recursos. Para Ayres, es la energía útil, o exergía (o, mejor dicho, el trabajo útil realizado con su consumo) lo que provoca los aumentos de productividad y, por ende, la creación de riqueza. Por tanto, ese cambio tecnológico (la A que aparece en la función de producción de Solow) depende de la disponibilidad de recursos.

Es aquí donde entra a colación el título de esta reseña. Como dice el autor, «esta vez es diferente», pues la sociedad se enfrenta por primera vez en la historia a la escasez de energía y de materiales, los cuales ponen en juego la posibilidad de crear riqueza material. Esto sigue siendo obviado por la mayoría de los economistas, que, en un exceso de optimismo tecnológico, todavía ven el conocimiento y el progreso técnico como disociado del consumo de recursos. Es decir, se sigue sin tener en cuenta la energía como fuente de riqueza y motor del crecimiento económico. Esto es así porque la mayoría de los modelos económicos que todavía se usan en la toma de decisiones asumen, erróneamente, que no hay límites a la oferta de energía. La misma miopía, nos indica el autor, parece aplicarse también a los recursos materiales, pues se sigue obviando la escasez geológica de los mismos.

En conclusión, no se puede permitir que la toma de decisiones se base en teorías ni en disciplinas que resultan extremadamente simplificadoras, como sucede con la economía. La riqueza material y el aumento del nivel de vida asociado van íntimamente ligados al consumo de recursos. Y la energía constituye el recurso fundamental, al ser necesario en cualquier proceso de transformación de unos recursos en otros.

Garantizar la continua provisión de estos recursos debería ser el objeto de la ciencia económica. Sin embargo, dado que hoy una parte considerable de la riqueza no es de carácter material, sino financiero, la disociación con nuestro entorno parece cada vez mayor. Esto hace que contribuciones como la de Bob Ayres con este libro sean cada vez más importantes, especialmente —aunque no solo— en las facultades de economía. Para que todos, incluidos quienes toman las decisiones, entendamos la base material de la vida, del proceso económico y, por ende, de la satisfacción de las necesidades humanas. Energy, complexity and wealth maximization debería ser de lectura obligada tanto para ecólogos como para economistas.

Impact of two policy interventions on dietary diversity in Ecuador

This is a summary of the paper: Ponce, J., Ramos-Martin, J. (2017): “Impact of two policy interventions on dietary diversity in Ecuador”, Public Health Nutrition, Vol. 20 (8):1473-1480, https://doi.org/10.1017/S1368980017000052.

PHNObjective: To differentiate the effects of food vouchers and training in health and nutrition on consumption and dietary diversity in Ecuador by using an experimental design.

Design: Interventions involved enrolling three groups of approximately 200 randomly selected households per group in three provinces in Ecuador. Power estimates and sample size were computed using the Optimal Design software, with a power of 80 %, at 5 % of significance and with a minimum detectable effect of 0·25 (sd). The first group was assigned to receive a monthly food voucher of $US 40. The second group was assigned to receive the same $US 40 voucher, plus training on health and nutrition issues. The third group served as the control. Weekly household values of food consumption were converted into energy intake per person per day. A simple proxy indicator was constructed for dietary diversity, based on the Food Consumption Score. Finally, an econometric model with three specifications was used for analysing the differential effect of the interventions.

Setting: Three provinces in Ecuador, two from the Sierra region (Carchi and Chimborazo) and one from the Coastal region (Santa Elena).

Subjects: Members of 773 households randomly selected (n 4343).

Results: No significant impact on consumption for any of the interventions was found. However, there was evidence that voucher systems had a positive impact on dietary diversity. No differentiated effects were found for the training intervention.

Conclusion: The most cost-effective intervention to improve dietary diversity in Ecuador is the use of vouchers to support family choice in food options.